

- Wink daily chart with the exhausted falling wedge formation.
- What’s in store for the digital asset?
Yerevan (CoinChpater.com) – Wink (WIN), a gaming token on the Tron blockchain, managed a breakout from the falling wedge it traded in since April. The gaming coin stood at 0.000361 against USDT (Tether USD Stablecoin) in Wednesday’s New York session. However, the breakout halted as Wink hit a confluence of resistance.
Wink daily chart
The falling wedge formation features two converging trendlines enveloping the price action and driving it down. The lower trendline was instrumental in keeping the Wink bears at bay. The upper trendline halted the bullish attempts and prevented breakouts.
The falling wedge is a reversal formation. After the pattern is complete, the digital asset may take a bullish route. It may then gain as much as the distance between the trendline at the start of the wedge. Should the pattern pan out, Wink could eye a 0.00135 USDT price, the highest value since April.
WIN exhausted the pattern on July 23, attempting a bullish breakout. The digital asset succeeded, but the price action turned sideways after meeting two resistance bars at once.
Also read: Blockchain gaming boom sees Small Love Potion (SLP) rise 179%
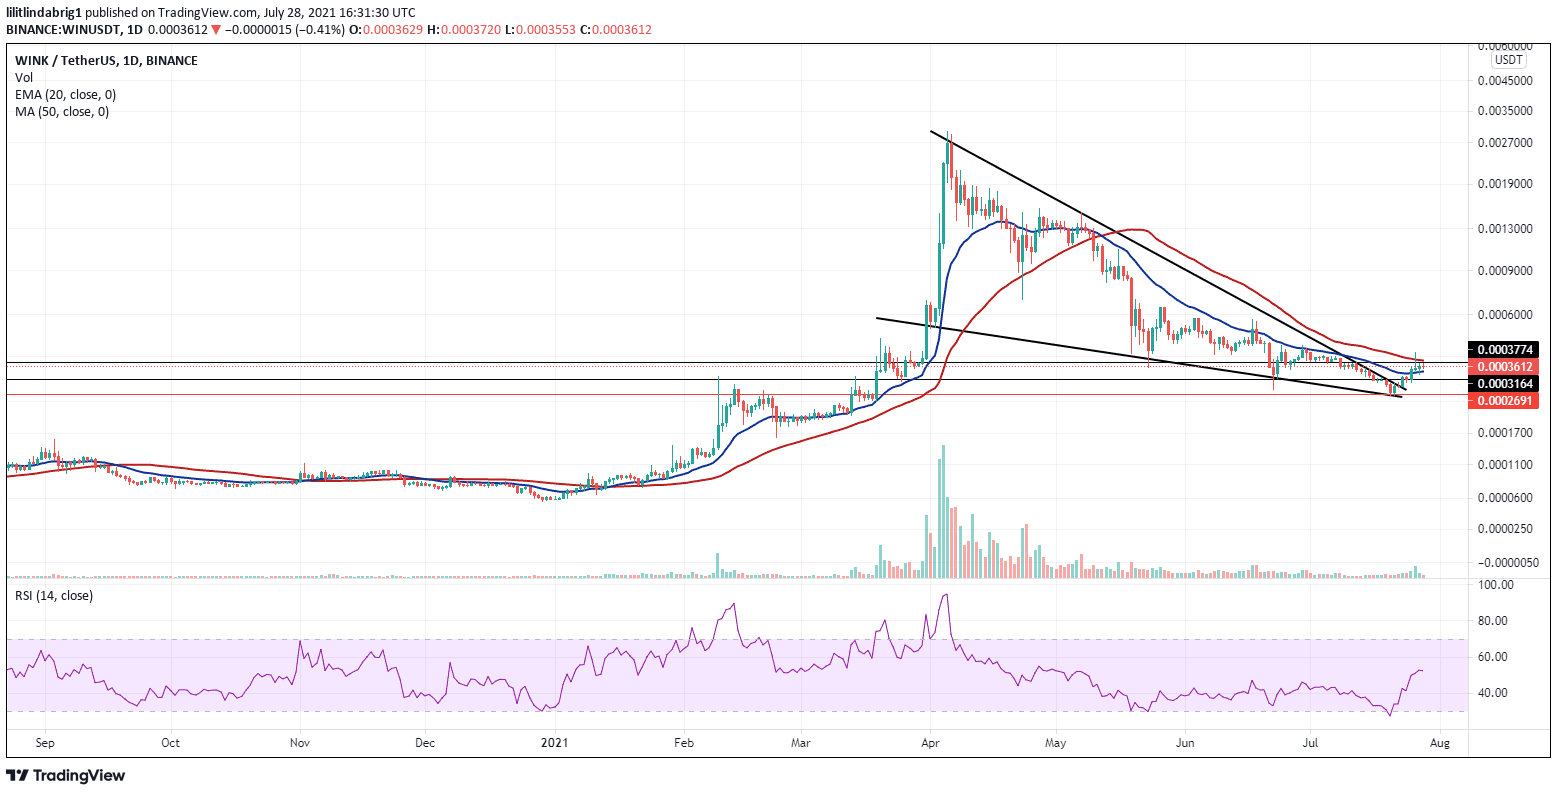
The first resistance lies at 0.00037 USDT. The line proved to be instrumental as both resistance and support since April. The 50-day simple moving average (SMA-50; red line) also contributed to WIN bears by capping the feeble uptrend.
Currently, the price action is capsuled by the SMA-50 and the 20-day exponential moving average (EMA-20; blue wave). The latter provided valuable support during the past few sessions.
Also read: Wink wobbles near bias-defining support while eyeing a 25% dip
What to expect?
Several outcomes currently look equally possible. If the bulls take over, WIN could break above the SMA-50 and head towards potential support/resistance lines at 0.00044 and 0.00051 USDT.
Should the Wink bears succeed instead, the price action could take the opposite route, going south. In the case of a bearish turn of events, there are also two support lines to retest at 0.00031 and 0.00026 USDT.
The third option is the sideways movement, which WIN seemed to adopt in the past three sessions. The Relative strength index (RSI) also followed suit, correcting the upward trend sideways.
In hindsight, the RSI indicates the traders’ attitude towards a particular stock or coin. When the RSI moves beyond the purple range at the bottom of the chart (30-70), the asset is considered oversold (falls below 30) or overbought (flies above 70). Either outcome affects the future price action and traders’ expectations.
The upcoming sessions will decide who will win: the Wink bears or the bulls.
Also read: BTT is among the most profitable tokens in the Tron ecosystem with 654% YTD profits.

… [Trackback]
[…] Read More Info here to that Topic: coinchapter.com/wink-win-wedge-breakout-halts-midway-as-bulls-battle-bears/ […]
… [Trackback]
[…] Find More to that Topic: coinchapter.com/wink-win-wedge-breakout-halts-midway-as-bulls-battle-bears/ […]