
SEI price action has aligned closely with the TD Sequential indicator over the past three weeks, according to market analyst Ali (@ali_charts). Each major move has followed the tool’s signals with notable accuracy, from local peaks above $0.36 to pullbacks near $0.29.
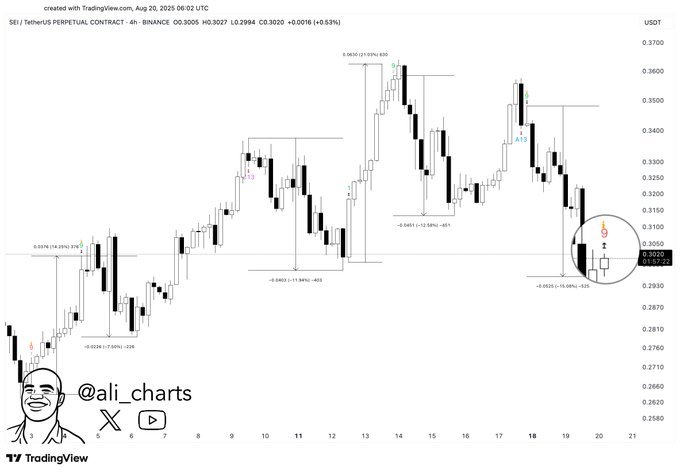
On August 20, the indicator produced a new buy signal on SEI’s 4-hour chart. The alert comes after a steady decline that pushed the token from mid-August highs above $0.35 down to lows around $0.29.
The chart shows the TD Sequential predicting reversals at multiple points. Earlier in August, it signaled exhaustion near $0.36 before a sharp correction. Later, it highlighted potential downside around $0.32, followed again by a pullback.
Now, the setup has flipped bullish. The tool’s latest reading suggests the downtrend may be near completion, potentially setting the stage for a rebound.
The buy signal emerges as SEI consolidates around $0.30 support. Traders often view such signals as potential entry points, especially when they align with historical consistency. Whether this rebound holds depends on broader market conditions, but the indicator’s track record in recent weeks adds weight to the current reading.
SEI Price Forms Ascending Channel With 170% Upside Potential
TheSEI/USDT daily chart from August 20, 2025, shows the token trading at $0.3018 while forming an ascending channel pattern. An ascending channel pattern occurs when price consistently moves higher within parallel upward-sloping trendlines, reflecting a structure of higher highs and higher lows.
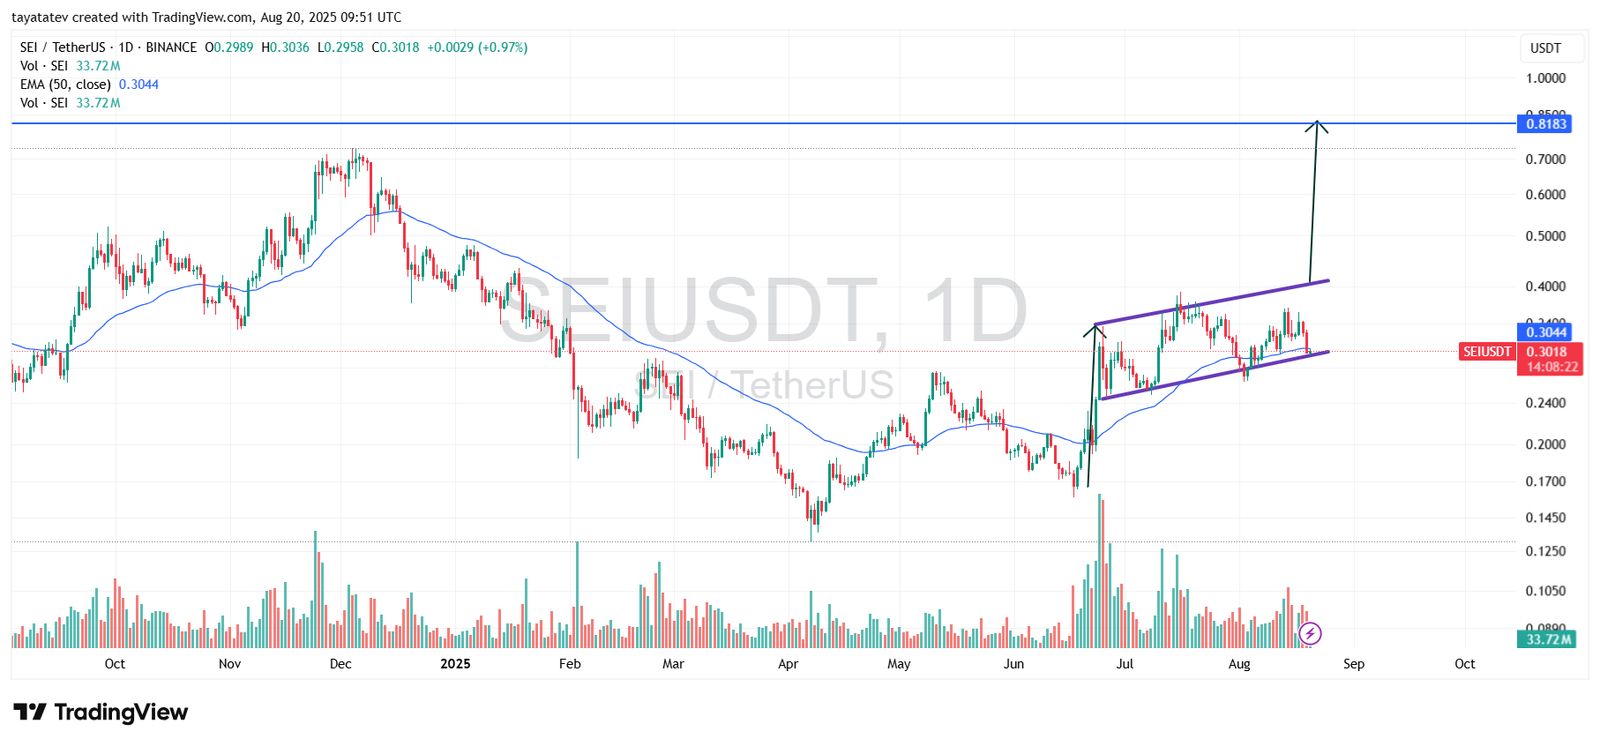
In this chart, SEI has been moving inside the channel since late June, with the lower boundary providing support around $0.29 and the upper boundary acting as resistance near $0.40. The price is now retesting the lower boundary, sitting just above the 50-day EMA at $0.3044. This positioning strengthens the channel’s validity, as buyers have previously defended this zone during pullbacks.
The projection drawn on the chart points to a possible breakout toward $0.8183. This target represents a potential 170 percent increase from the current price. The measurement aligns with the channel height, extended from the breakout point, which is a common method of estimating upside potential in this type of pattern.
Volume trends also provide confirmation. Spikes in buying activity accompanied earlier upward surges, while selling pressure during pullbacks has been relatively contained. This suggests accumulation rather than distribution. If momentum continues to favor bulls and SEI breaks above the upper boundary, the path toward $0.8183 becomes more likely.
However, until a confirmed breakout occurs, the ascending channel continues to guide SEI within its parallel boundaries. Sustained closes below $0.29 could invalidate the pattern and shift focus back to lower levels, but as long as the structure holds, the chart signals strong bullish potential.
SEI Balance of Power Indicator Signals Bullish Pressure
The SEI Balance of Power (BOP) chart dated August 20, 2025, shows the reading at 0.28, which reflects moderate bullish strength in the market. The Balance of Power indicator measures the force of buyers versus sellers, with values above zero suggesting buyers dominate and values below zero pointing to seller control.
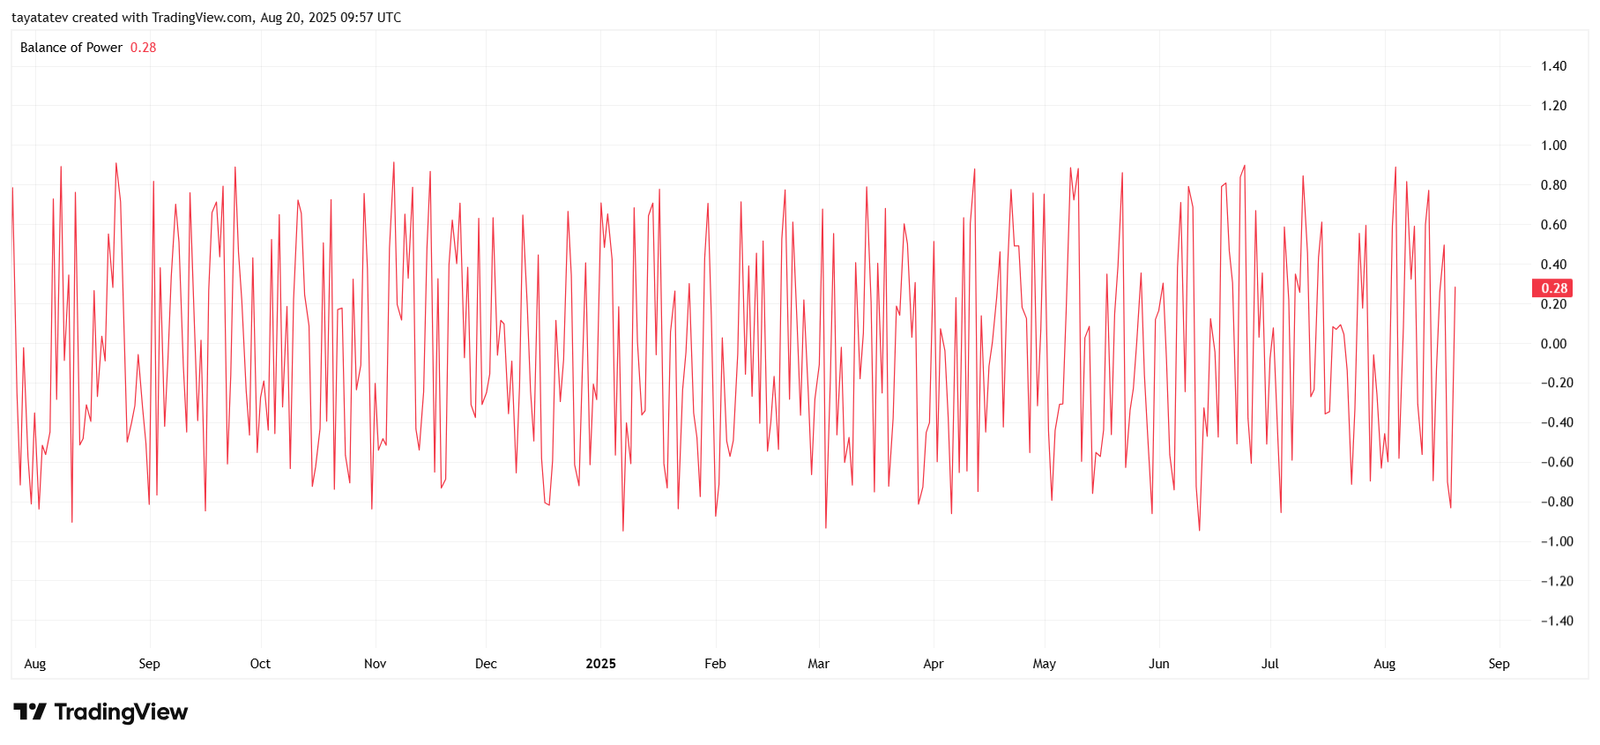
In this case, SEI maintains a positive BOP level, showing that demand outweighs supply despite recent volatility. The chart illustrates frequent sharp swings between negative and positive zones over the past year, but the current reading stands in the green territory. This suggests that the market leans toward accumulation rather than distribution.
The persistence of BOP above zero often aligns with upward continuation in price trends. Coupled with the ascending channel pattern seen on the daily chart, this signal strengthens the possibility of SEI building momentum for another leg higher. However, if BOP falls back below zero, it would indicate a shift in pressure toward sellers and weaken the bullish setup.
SEI RSI Points to Neutral Momentum With Slight Bullish Edge
The SEI RSI chart dated August 20, 2025, shows the Relative Strength Index (RSI) at 46.01, with the signal line reading 52.77. The RSI is a momentum indicator that measures the speed and magnitude of price movements, where values above 70 suggest overbought conditions and values below 30 indicate oversold levels.
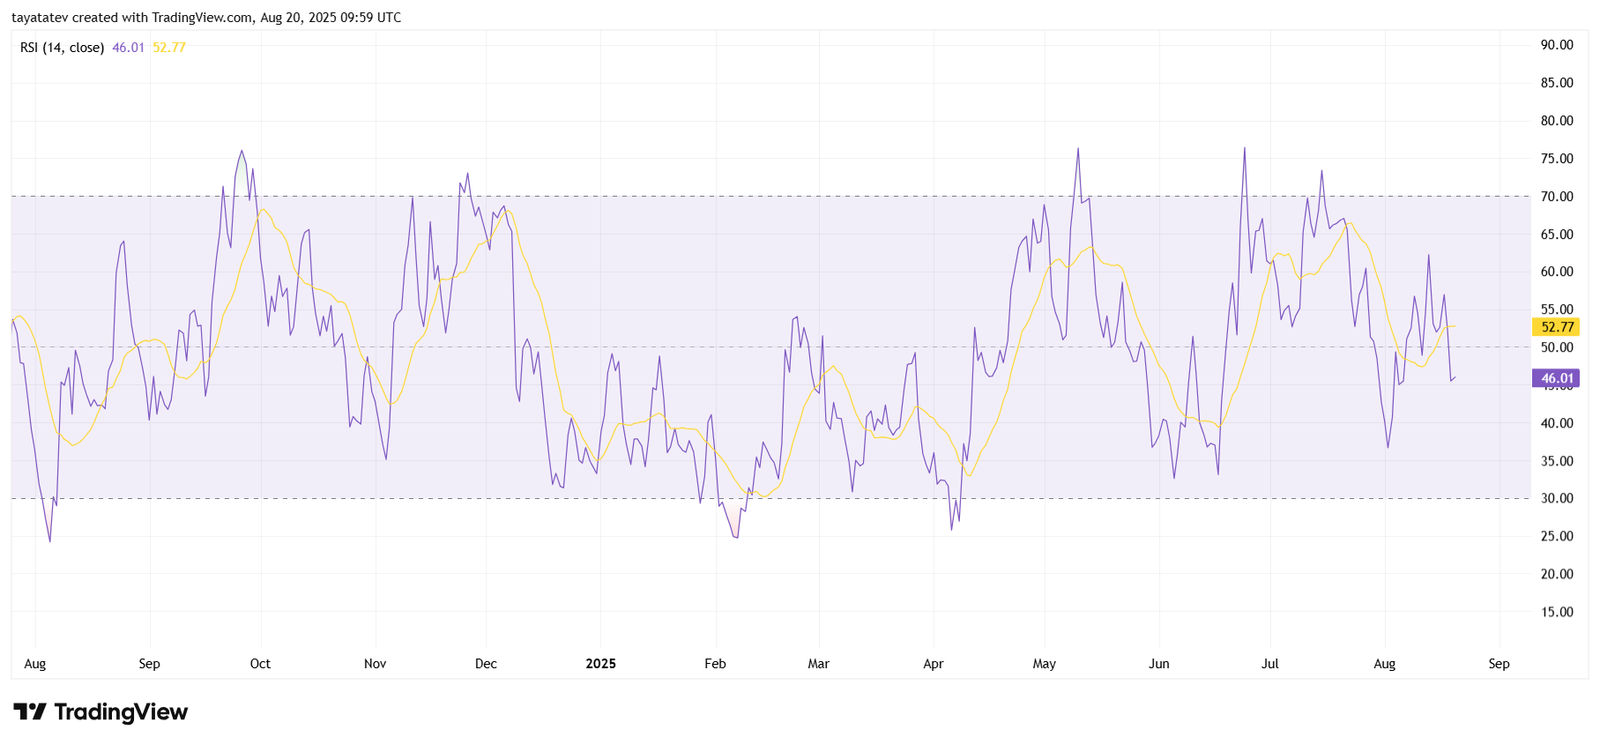
Currently, SEI’s RSI sits in the neutral range, slightly below 50, which indicates balanced momentum between buyers and sellers. However, the signal line remains above the RSI, hinting at an early bullish crossover that could develop if momentum strengthens. This setup suggests that while the market is not yet strongly trending, conditions are leaning toward a potential rebound if buying pressure increases.
Looking at the broader chart history, RSI swings have frequently shifted between oversold and overbought levels, reflecting high volatility in SEI’s price movements. The present neutral zone suggests consolidation, but as long as the RSI avoids a deeper drop toward 30, bullish traders may interpret it as a chance for renewed upside.
Together with the ascending channel pattern and positive Balance of Power reading, the RSI supports a cautious but slightly bullish outlook. If the RSI moves above 55 in the coming sessions, it would add confirmation that SEI is regaining momentum for a stronger upward push.
SEI MACD Signals Early Bullish Momentum Shift
The SEI MACD chart dated August 20, 2025, shows the MACD line at 0.0018 and the signal line at 0.0038, with the histogram printing a small negative value of –0.0020. The MACD (Moving Average Convergence Divergence) measures trend strength and direction by comparing two moving averages, while the histogram reflects the difference between the lines.
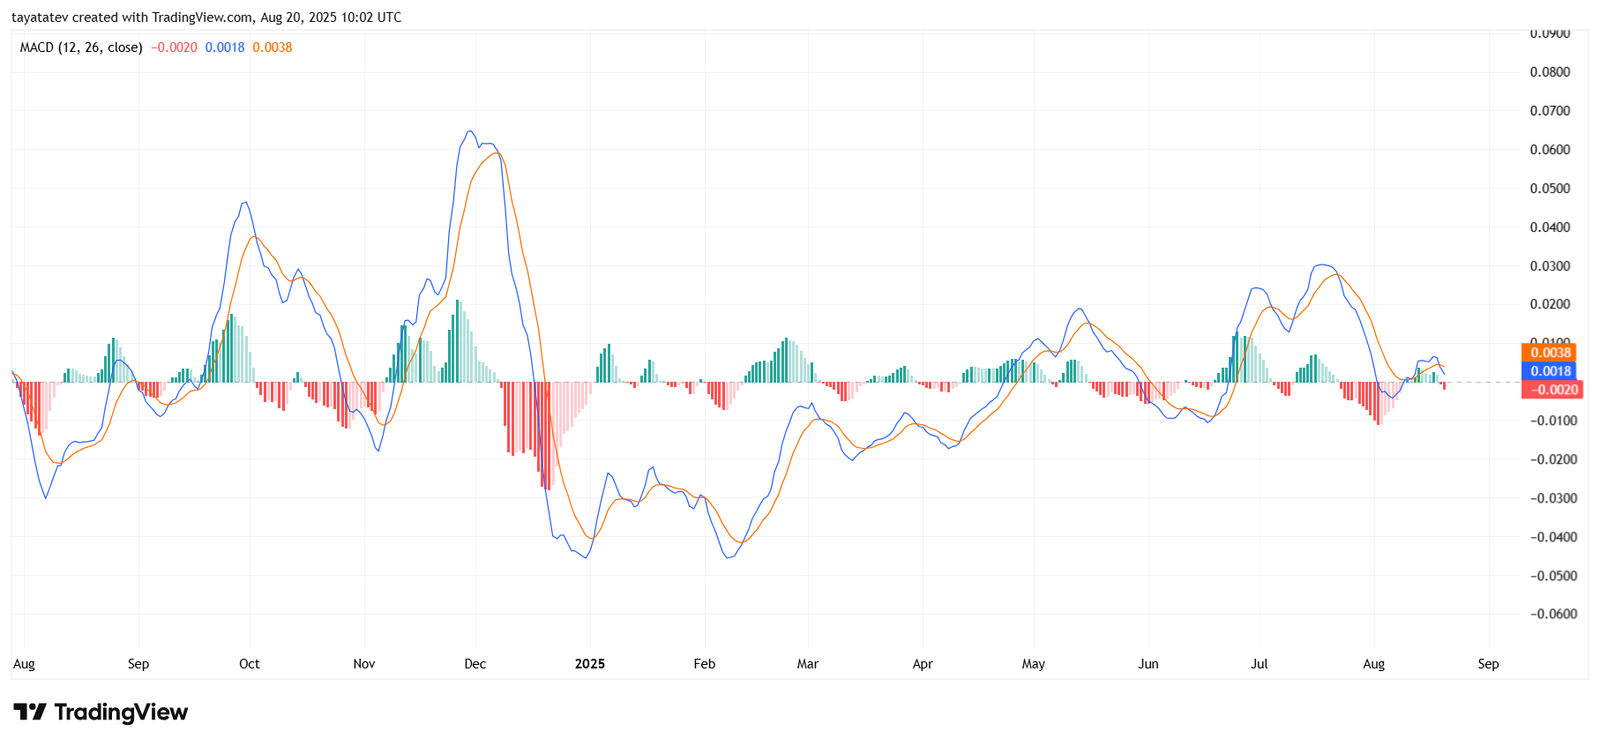
Currently, SEI sits in a transitional phase. The histogram has started to shrink on the negative side, indicating that bearish momentum is weakening. At the same time, the MACD line is approaching the signal line from below, which often precedes a bullish crossover. If the blue MACD line crosses above the orange signal line in the next sessions, it would confirm a shift toward positive momentum.
Looking back on the chart, earlier bullish crossovers in October, March, and July triggered strong upward moves, supported by expanding green histograms. In contrast, bearish crossovers marked local tops and declines. The present setup shows SEI near another potential bullish shift, although confirmation is needed with a clear crossover and strengthening histogram bars above zero.
If momentum continues building, the MACD may align with the ascending channel and RSI signals, supporting the view that SEI is preparing for another leg higher. Conversely, failure to cross and renewed red histogram expansion would signal continued consolidation or downside pressure.
