
Key Takeaways:
- A crypto analyst highlighted that SHIB price had formed a buy signal.
- The Shiba Inu token price might be bottoming out.
- SHIB is moving inside a bearish technical pattern.
NEW DELHI (CoinChapter.com) — Meme token Shiba Inu’s SHIB token price might be getting ready for a rally if the token repeats its performance following the appearance of a technical indicator.
Crypto analyst Ali Martinez highlighted that the TD Sequential, a technical indicator, flashed a bullish signal for SHIB price. The analyst stated that the indicator has been historically bullish for the Shiba Inu token.
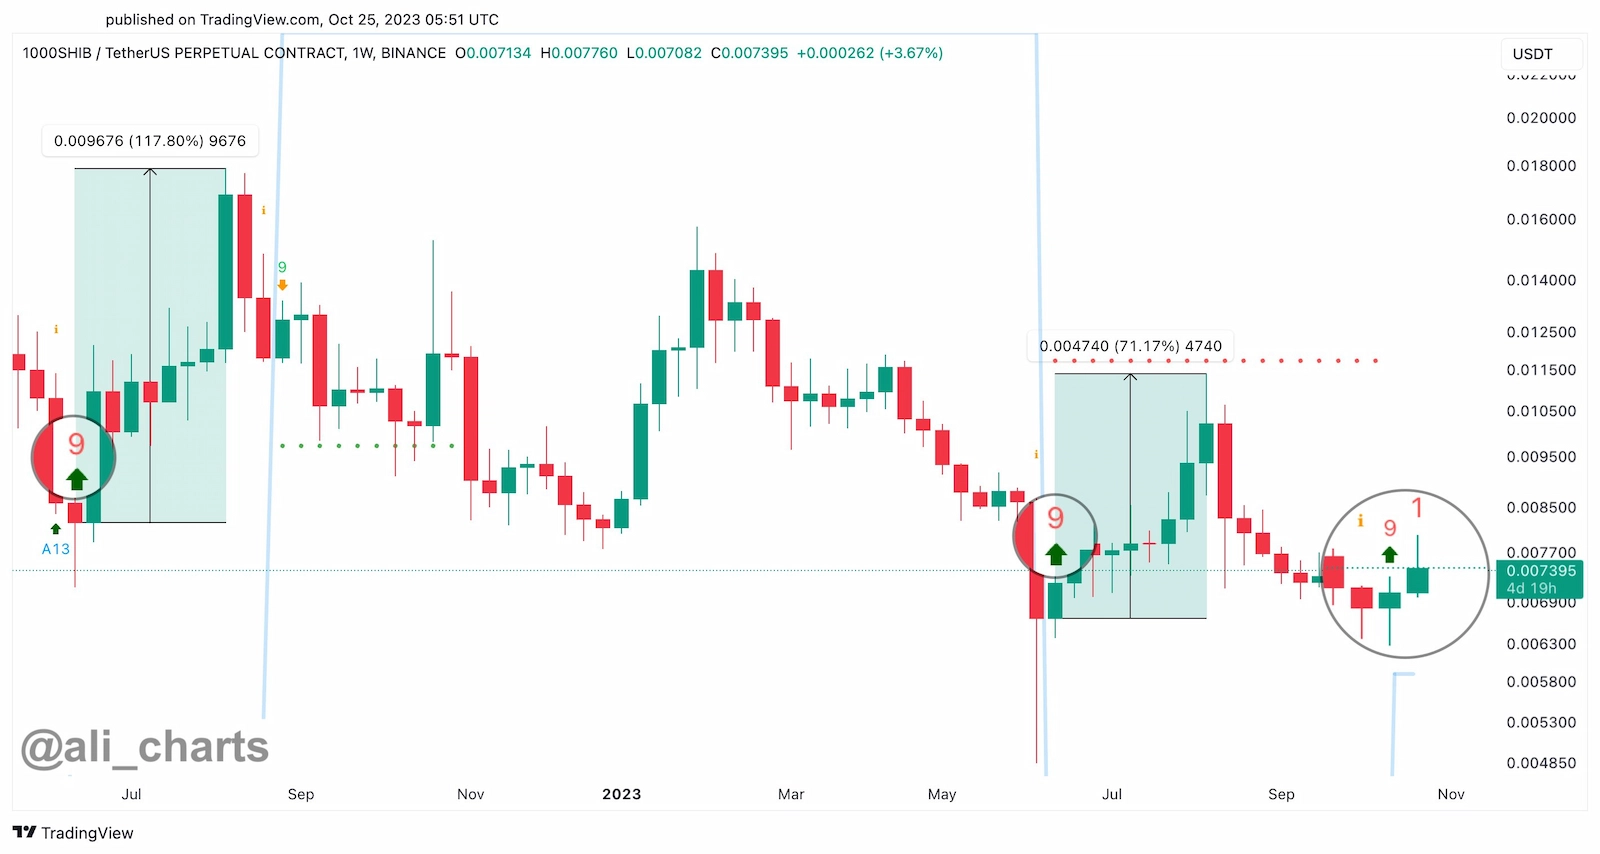
Martinez noted that the last two times SHIB rallied after the indicator flashed a buy signal, the memecoin 118% and 71%.
Given the infrequency yet precision of such signals, it’s a pivotal moment to keep a keen eye on SHIB
Ali Martinez said.The analyst’s observation led to speculation that the meme token’s price has started bottoming out, meaning that it has exhausted its bearish pressure and it now gearing up for a rally.
Tom DeMark, founder and CEO of DeMark Analytics, introduced the TD Sequential technical indicator in his book “The New Science of Technical Analysis.”
Traders and analysts often claim that the TD Sequential helps identify the exact time of trend exhaustion and price reversal.
Crypto traders remained bullish on SHIB’s price prospects. However, it seems the bullishness might be purely hype, evident from Floki Inu’s 100% gains in its recent rally.
Influencers and traders are hyping every little piece of positive news in order to keep the hype going.
SHIB Price Moving Inside Bearish Pattern
Meanwhile, SHIB price is moving inside a bearish technical pattern called the ‘Descending Triangle.’
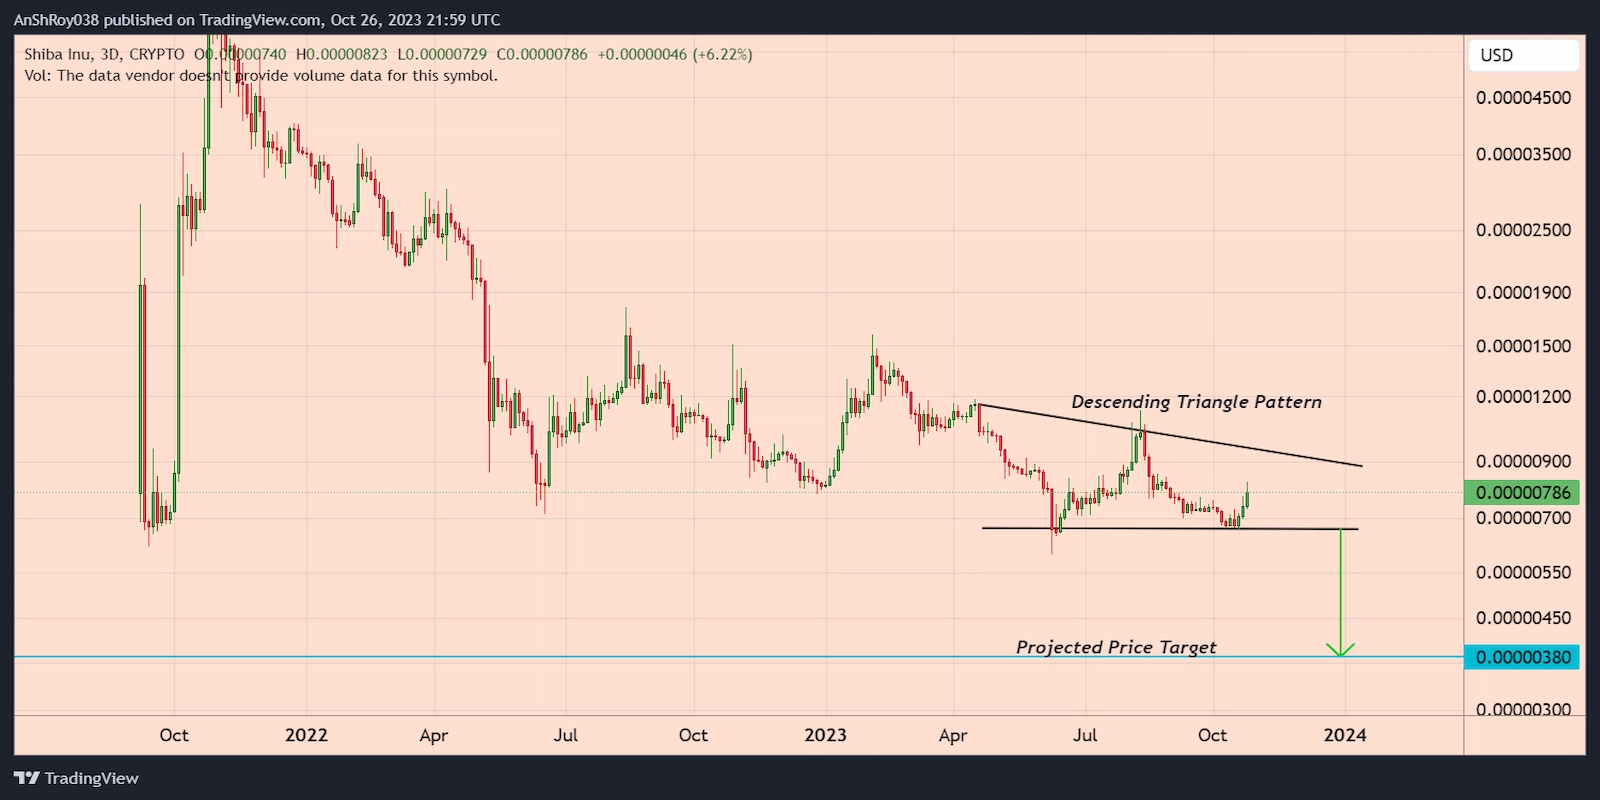
A descending trendline connecting swing highs and a horizontal trendline joining swing lows form the pattern. The height of the triangle’s thickest section determines the price target in a descending triangle setup.
The pattern gives SHIB prices a theoretical breakdown target near $0.0000038, a drop of nearly 52% from the token’s current price levels.
SHIB Price Pares Gains
The Shiba Inu token price pared gains as bears started booking profits after SHIB price reached its highest level since Sept. 1 earlier this year. However, the volatility in the market is visible in the long upper and lower wicks on both ends of Oct. 26’s daily candle.
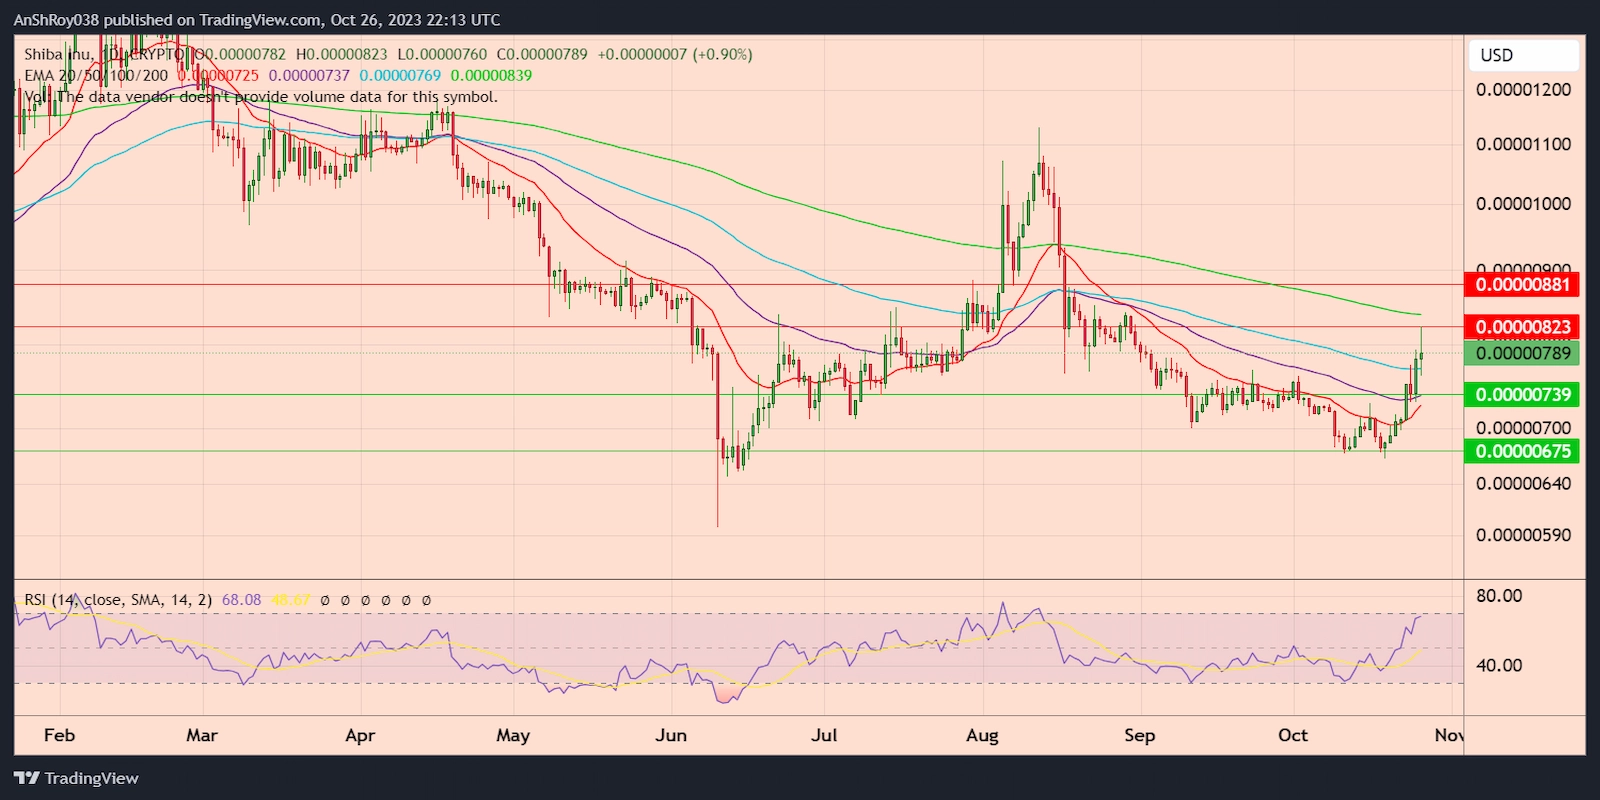
SHIB price rallied 8.3% to reach a daily high near $0.00000823 before correcting. If the selling continues, bulls would be forced to defend the 50-day EMA ( the purple wave) support near $0.0000074.
Moreover, breaching the immediate support might result in increased selling pressure, forcing the meme token’s price to test the support near $0.0000067.
Conversely, an uptrend would see the meme token’s price challenge the resistance near $0.00000823. Breaking and consolidating above the immediate resistance might help the SHIB price rally to the resistance near $0.0000088 before retreating.
The RSI for SHIB remained neutral, albeit close to the overbought threshold of 70, with a score of 68.08 on the daily charts.

… [Trackback]
[…] There you will find 12893 more Information to that Topic: coinchapter.com/shib-price-bottoming-out-analyst-highlights-buy-signal-for-shiba-inu/ […]
… [Trackback]
[…] Info to that Topic: coinchapter.com/shib-price-bottoming-out-analyst-highlights-buy-signal-for-shiba-inu/ […]
… [Trackback]
[…] Read More on that Topic: coinchapter.com/shib-price-bottoming-out-analyst-highlights-buy-signal-for-shiba-inu/ […]
… [Trackback]
[…] Find More here to that Topic: coinchapter.com/shib-price-bottoming-out-analyst-highlights-buy-signal-for-shiba-inu/ […]