Key Takeaways:
- Meme token Shiba Inu has started attracting investors, evident from whale transactions.
- SHIB price is moving inside a bullish pattern.
NEW DELHI (CoinChapter.com) — Investor interest in meme token SHIB, a native token of the Shiba Inu ecosystem, is on the rise, according to a report by on-chain market analysis platform Santiment.
Whale transactions involving SHIB tokens have been on the rise. The pattern suggests the meme token, which is down nearly 90% from its Nov 2021 all-time high, is gradually regaining traders’ attention.
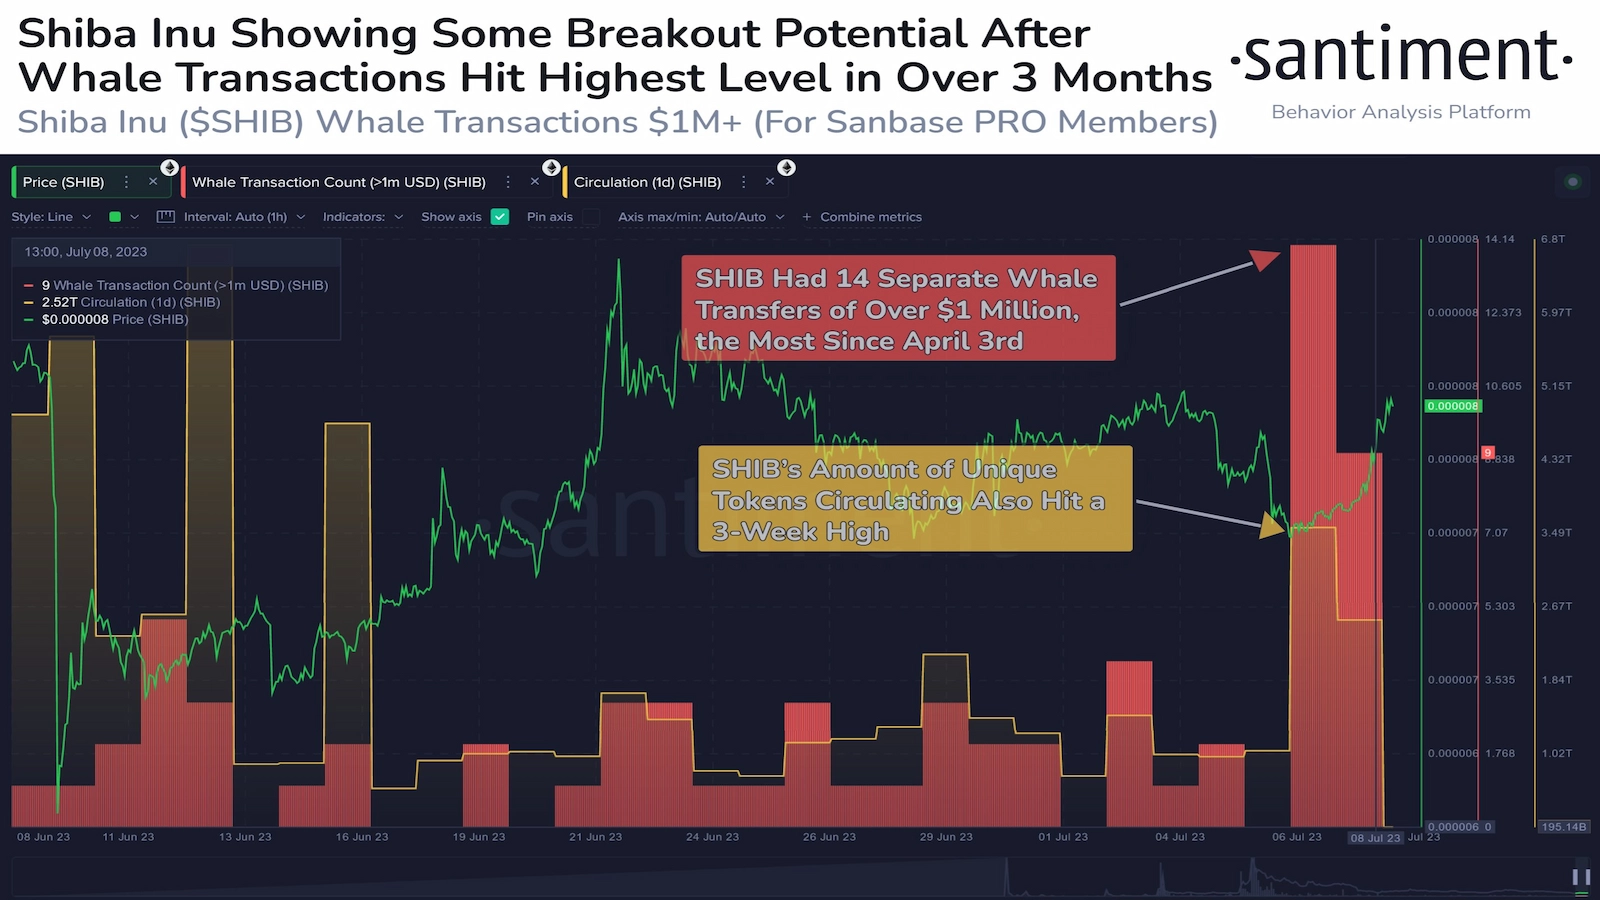
Santiment highlighted that the Shiba Inu token saw its highest whale transactions since April 3. Moreover, the number of unique tokens in circulation hit a 3-week high, underscoring the attention that SHIB has garnered.
Additionally, Shiba Inu’s burn rate spiked to 4,357% over the past 24 hours, burning nearly 638.5 million SHIB tokens. Furthermore, users speculate that the launch of Shibarium would result in Shiba Inu burning nearly 5 trillion SHIB tokens monthly.
Meanwhile, SHIB price has formed a bullish technical pattern called the ‘Falling wedge.’
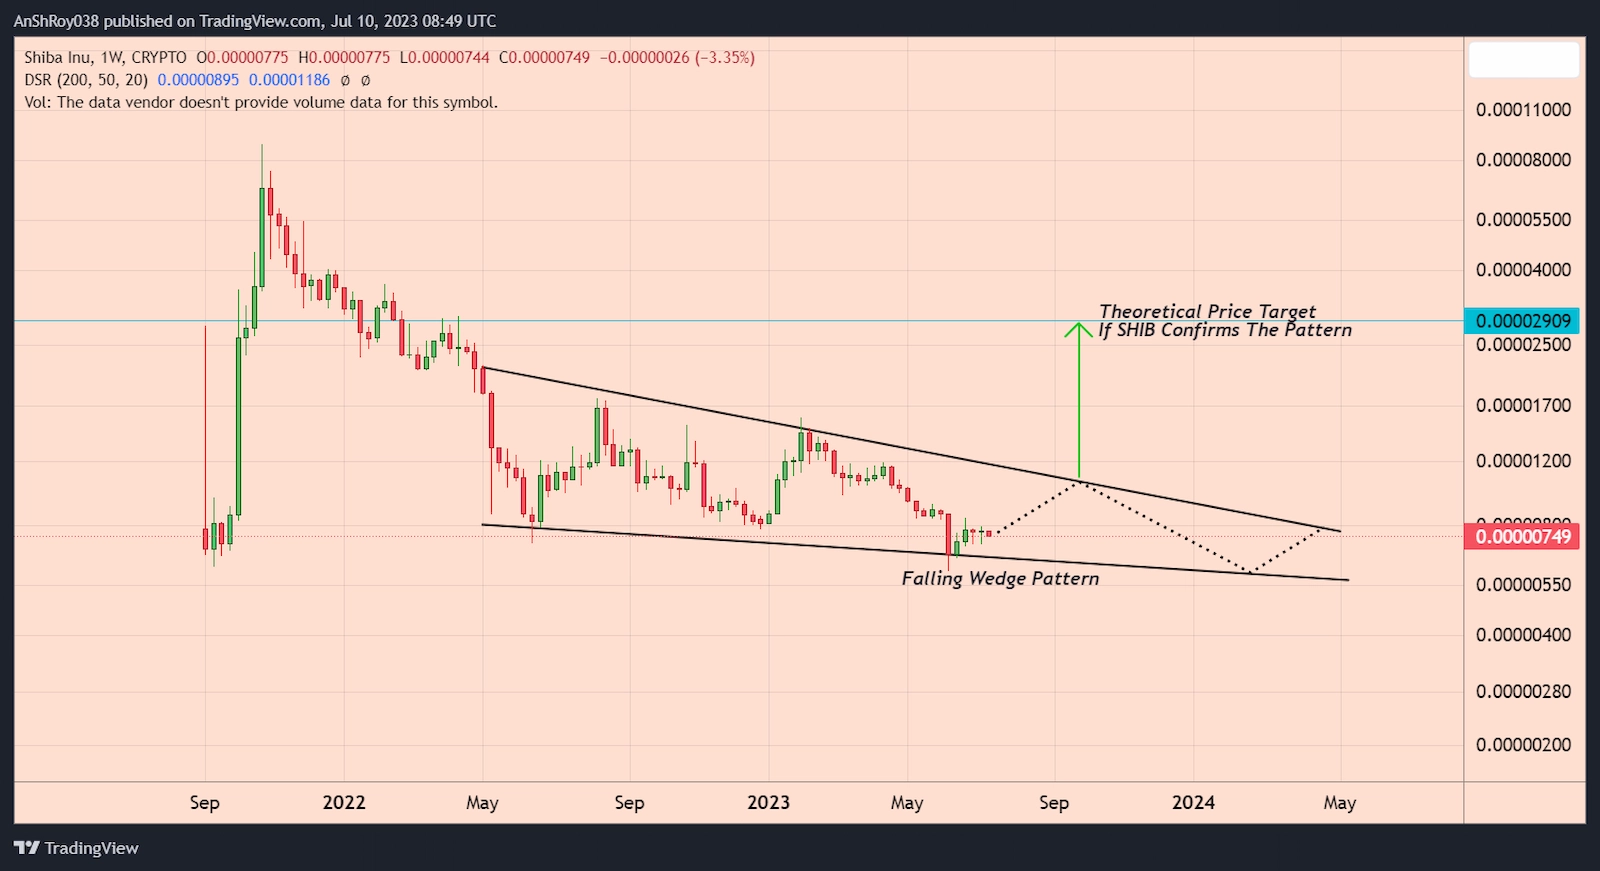
In detail, the technical pattern forms when the price fluctuates inside a pair of falling trendlines that would converge down the slope. The outcome of such downside patterns is typically a price breakout to the upside.
One key feature of the pattern is that volumes usually decline as the trendlines converge.
The upside target for the breakout is equal to the maximum distance between the falling wedge’s upper and lower trendlines. Per the rules of technical analysis, SHIB price might jump to $0.0000291, a jump of 288% from current levels.
SHIB Price Struggles With EMA Resistance
The meme token continued to struggle against the 50-day EMA (purple wave) resistance, with the latest rebuff resulting in SHIB price falling 4% to a daily low of $0.00000744 on July 10. However, bulls recovered some of the day’s losses.
If the downtrend continues, SHIB price might drop below the 20-day EMA (red wave) bulls are currently defending and test the support near $0.00000739.
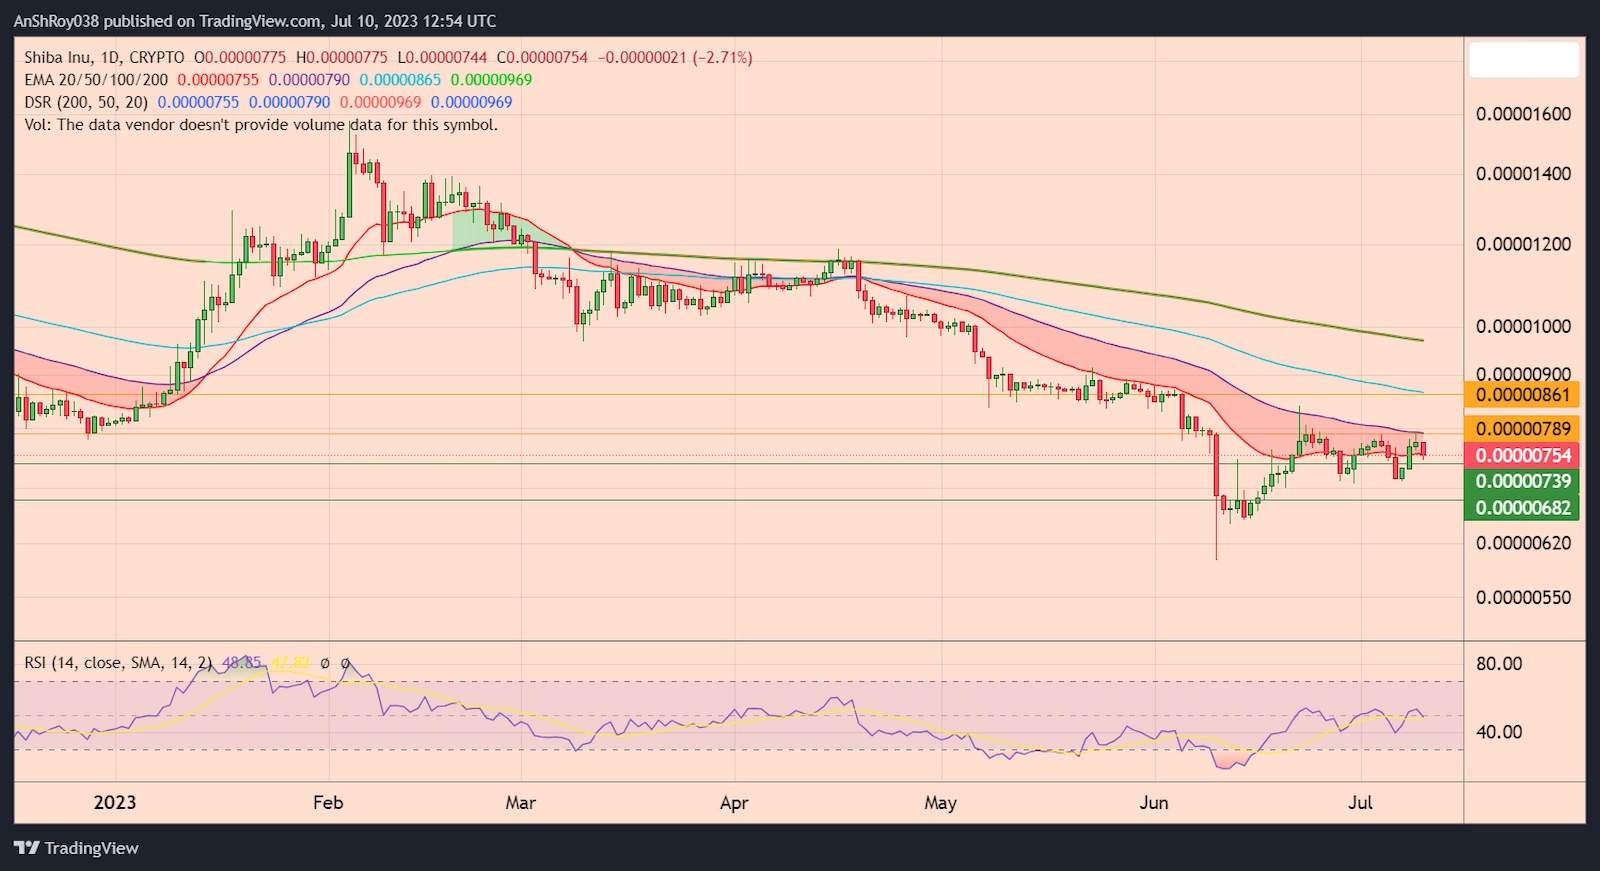
Moreover, the failure of the immediate support level might result in SHIB price falling to the support near $0.0000068 before recovering.
On the other hand, bulls would need to conquer the 50-day EMA resistance near $0.00000789 to signal a strong uptrend. Furthermore, breaking and consolidating above the immediate resistance might help SHIB price challenge the resistance near $0.0000086 before correcting.
The RSI for SHIB remained neutral, clocking on the 48.85 on the daily chart.

… [Trackback]
[…] Read More on on that Topic: coinchapter.com/shiba-inu-back-on-investors-radars-says-report-as-shib-price-continues-to-consolidate/ […]
… [Trackback]
[…] Information on that Topic: coinchapter.com/shiba-inu-back-on-investors-radars-says-report-as-shib-price-continues-to-consolidate/ […]