
On May 29, 2025, the SHIBA INU (SHIB/USD) 4-hour chart created a descending channel pattern. A descending channel forms when the price moves between two downward-sloping parallel trendlines, showing a temporary consolidation inside a bearish structure. The upper trendline acts as dynamic resistance, while the lower one serves as support.
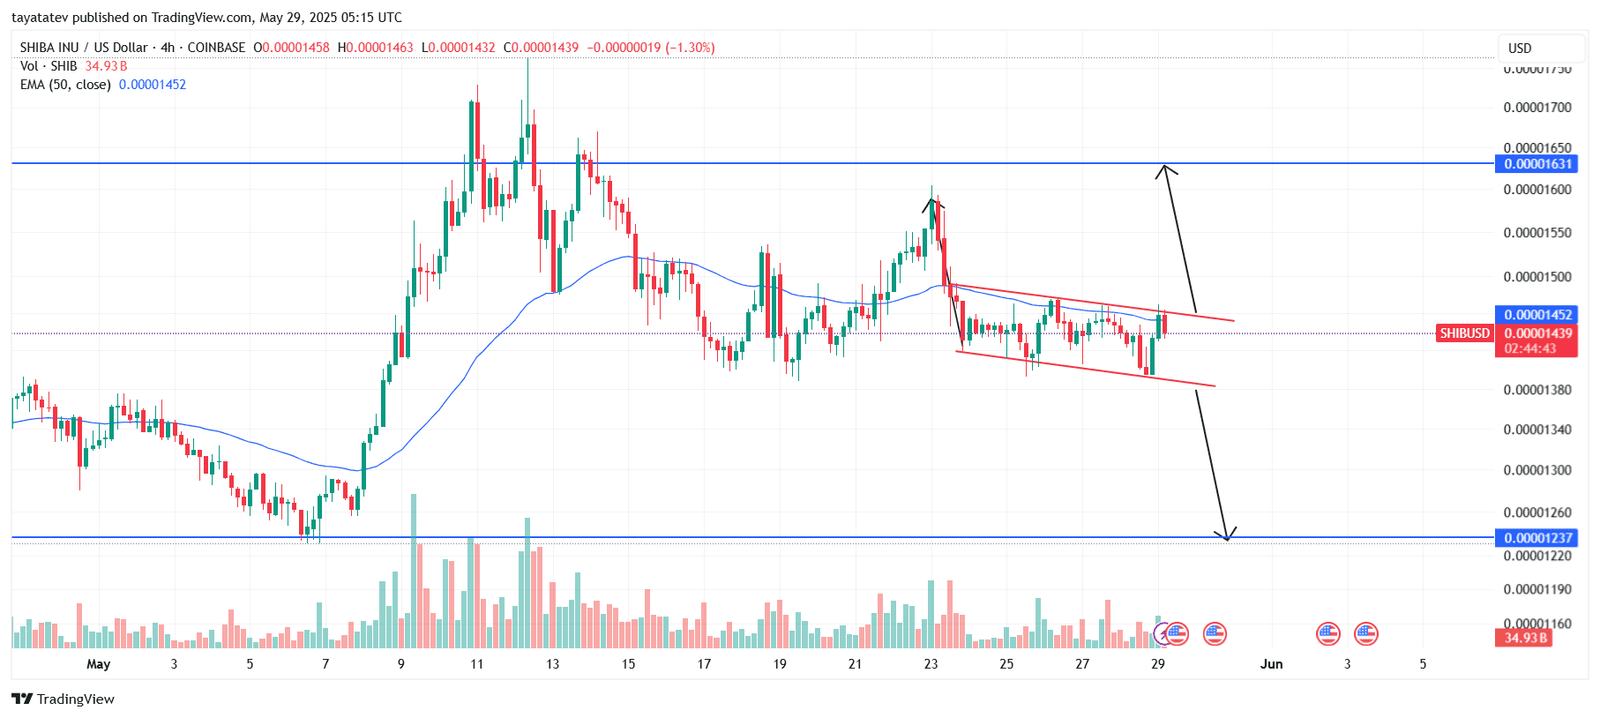
If SHIB breaks above the descending channel, it may rally 13% from the current price of $0.00001439 to around $0.00001631. This price level also acted as resistance earlier in May and could cap the upside if tested again. A confirmed breakout would require a strong bullish candle closing above the upper red trendline, likely supported by increasing volume.
If SHIB fails to break out and instead drops below the lower boundary of the channel, it may fall 14% from $0.00001439 to around $0.00001237. This level marks the nearest strong support, which previously triggered a reversal in early May. A breakdown confirmation would likely come from a close below the lower red trendline, accompanied by higher-than-average selling volume.
The 50-period Exponential Moving Average (EMA), currently near $0.00001452, acts as a dynamic resistance. The price trades just below it, suggesting continued bearish pressure until a clear breakout occurs.
Both scenarios depend on volume confirmation and price behavior around the trendlines. For now, SHIB trades inside the channel, awaiting a directional move.
SHIBA INU RSI Signals Neutral Momentum as of May 29, 2025
The Relative Strength Index (RSI) 14 for SHIBA INU (SHIB/USD) stood at 49.38 on May 29, 2025, while its RSI-based moving average sat at 46.14. The RSI measures momentum by comparing the magnitude of recent gains to recent losses. Values above 70 indicate overbought conditions, and values below 30 suggest oversold conditions.
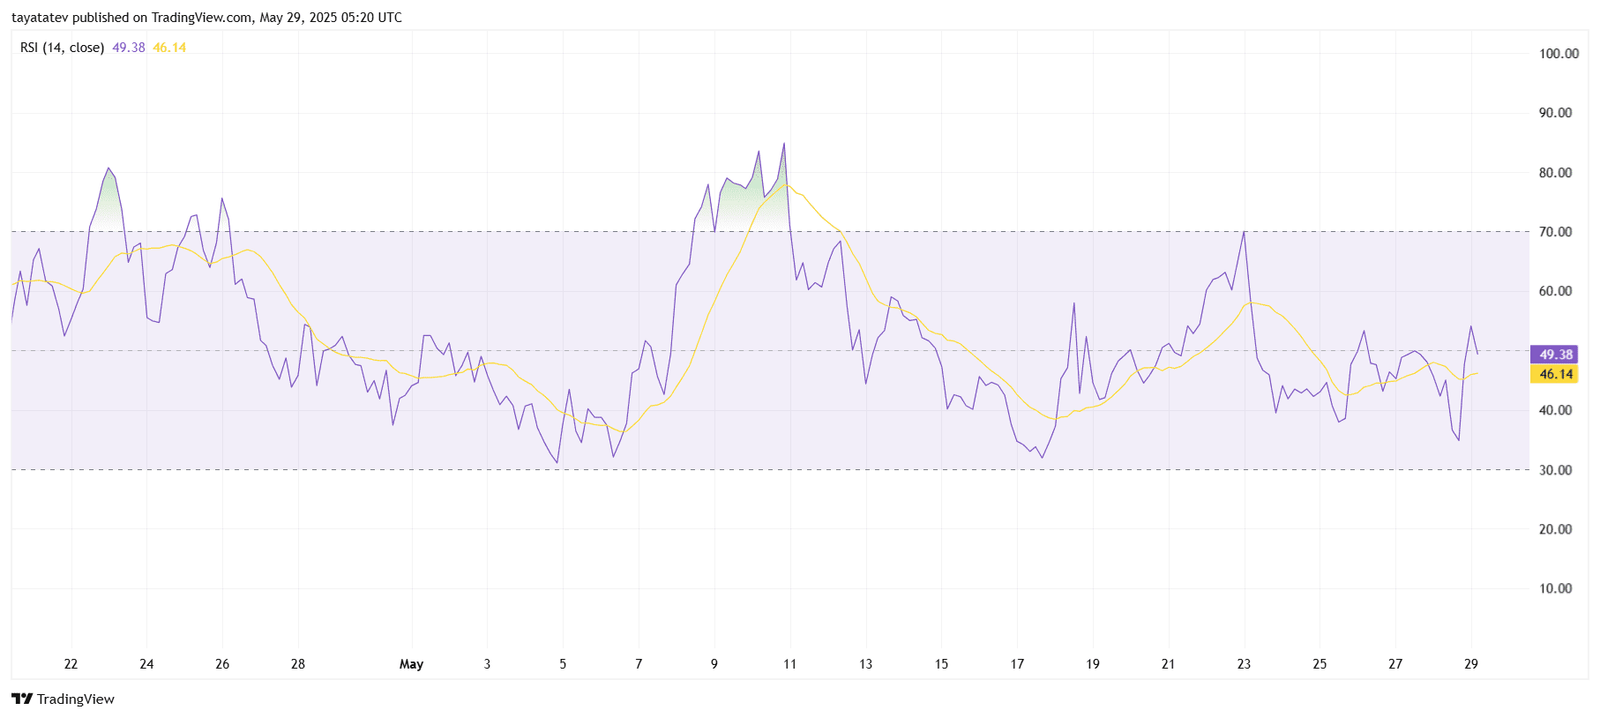
Currently, the RSI remains below the neutral 50 level, but it shows signs of recovery. The index recently bounced back from the 40 zone and now hovers just under 50. This position signals neutral to slightly bearish momentum, with no strong buying or selling pressure.
The RSI line also crossed above its moving average, which often precedes a short-term price push. However, the strength of this signal depends on whether RSI can sustain above the 50 mark. If it fails and reverses again, it would confirm the ongoing sideways trend.
This neutral RSI reading supports the ongoing range-bound movement inside the descending channel. For a bullish breakout to confirm, RSI must break above 50 and push toward the 60–70 zone with rising volume. On the other hand, if RSI drops below 40 again, it would signal growing bearish pressure, strengthening the chances of a breakdown from the channel.
SHIBA INU (SHIB) Consolidates Inside Descending Triangle, 17% Break Imminent
As of May 27, 2025, the 4-hour chart of Shiba Inu (SHIB/USD) shows the token consolidating inside a descending triangle. This pattern features a flat support base and a downward-sloping resistance line. It often signals a continuation of the prior trend, although it may also trigger a reversal under certain market conditions.
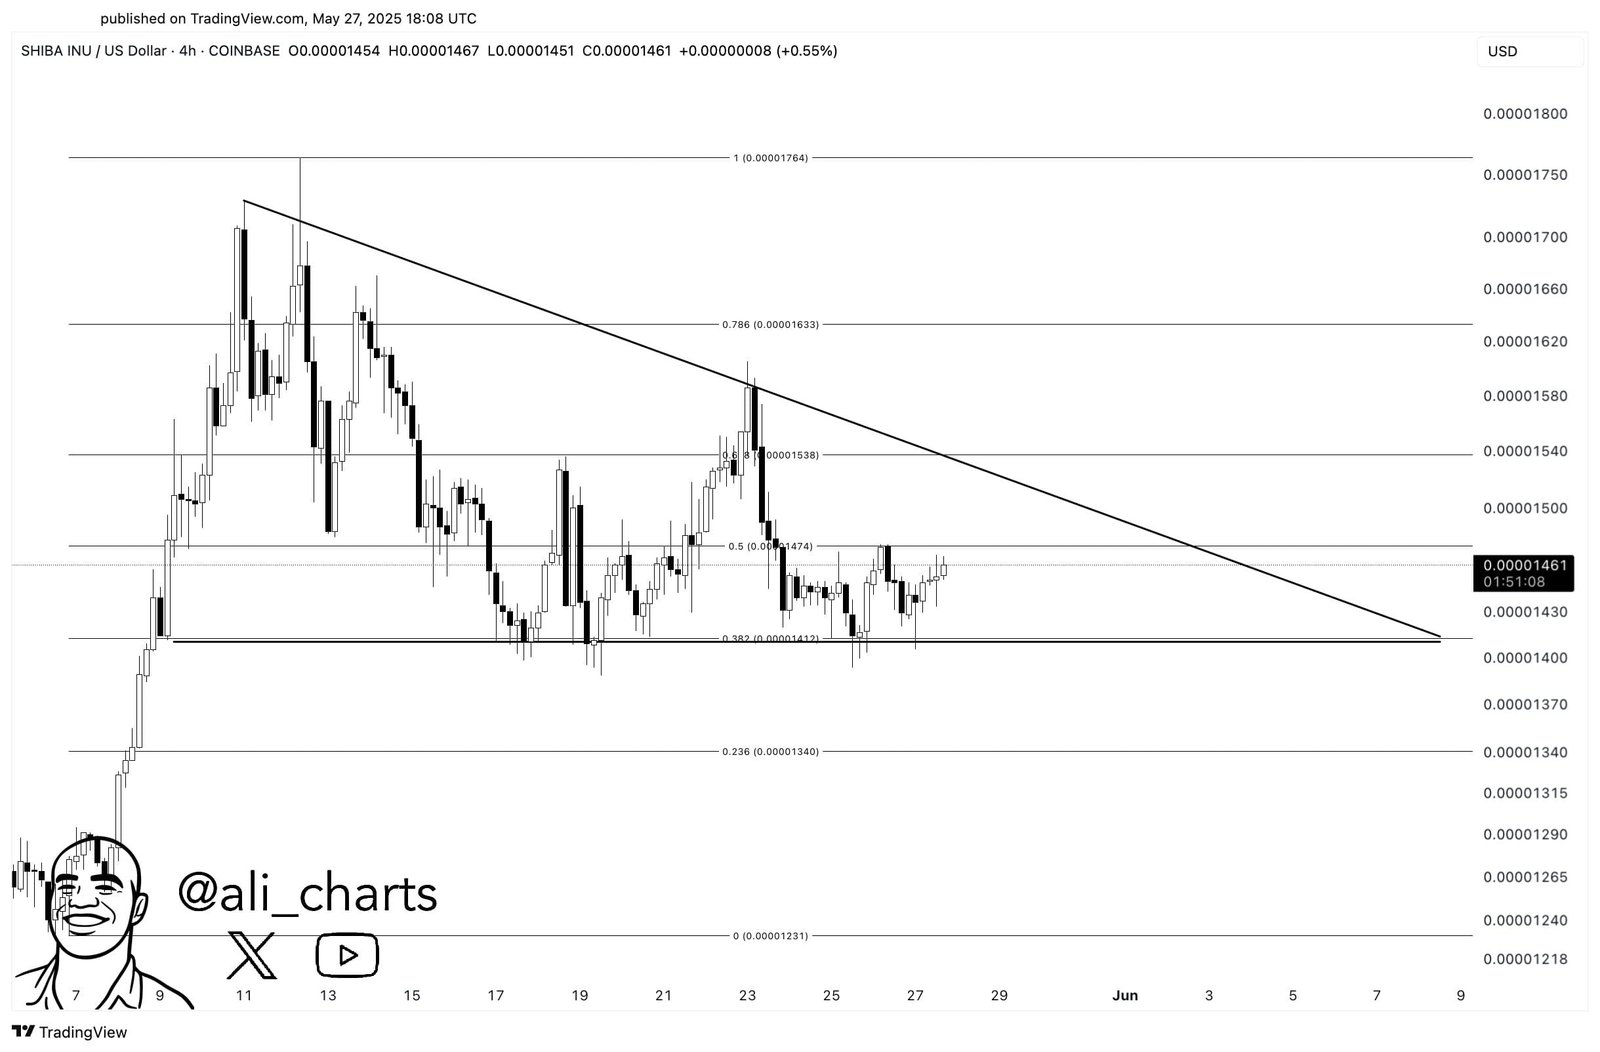
The descending triangle on the SHIB chart forms between resistance near the 0.618 Fibonacci retracement level around $0.00001538 and horizontal support close to $0.00001430. The triangle is tightening, with price compressing between the trendlines over the past two weeks.
Analyst Ali Martinez, who shared the chart on X, noted that SHIB could witness a 17% price swing once the breakout occurs. Based on the triangle’s height, the breakout target could be projected either up or down, depending on the direction of the breach.
If SHIB breaks above the descending resistance, it could rally toward $0.00001764, which aligns with the Fibonacci extension and recent highs. This outcome would require strong bullish volume and a decisive close above both the trendline and $0.00001538.
If the token drops below the triangle’s base at $0.00001430, it may fall toward the $0.00001231 support zone. That would complete a full 17% downside swing, matching the triangle’s height. A breakdown confirmation would require sustained selling volume and multiple candles closing below support.
