NOIDA (CoinChapter.com)—Shiba Inu’s (SHIB) price has struggled to regain footing amid broader market volatility. The token dropped over 15% on March 3 before recovering in recent sessions. SHIB price’s decline aligns with the market-wide downturn as risk assets faced increased pressure.
SHIB dropped to a key support region after failing to hold above crucial resistance levels. The price decline also coincided with a notable drop in open interest (OI), signaling a reset in leveraged positions.
However, technical indicators now suggest that SHIB could be nearing a turning point. A bullish technical pattern has emerged for the Shiba Inu coin, which could help the token paint a reversal. Derivatives data further supports this possibility, as funding rates are positive, indicating that long positions dominate the futures market.
This suggests traders are positioning for upside, but if funding rates rise too aggressively, it could lead to overleveraging and a potential long squeeze. If bulls sustain momentum at current levels, SHIB could see a sharp recovery. Whether the pattern confirms a breakout or further downside depends on the strength of incoming volume and market sentiment.
Bullish Setup And Derivatives Data Hint At Reversal?
The SHIB USD pair has formed a bullish technical pattern called the falling wedge. The pattern forms when price action contracts between two downward-sloping trendlines, signaling a decline in volatility and selling pressure. Traders consider the pattern a bullish reversal structure, with a breakout confirmed when price moves above the upper boundary.
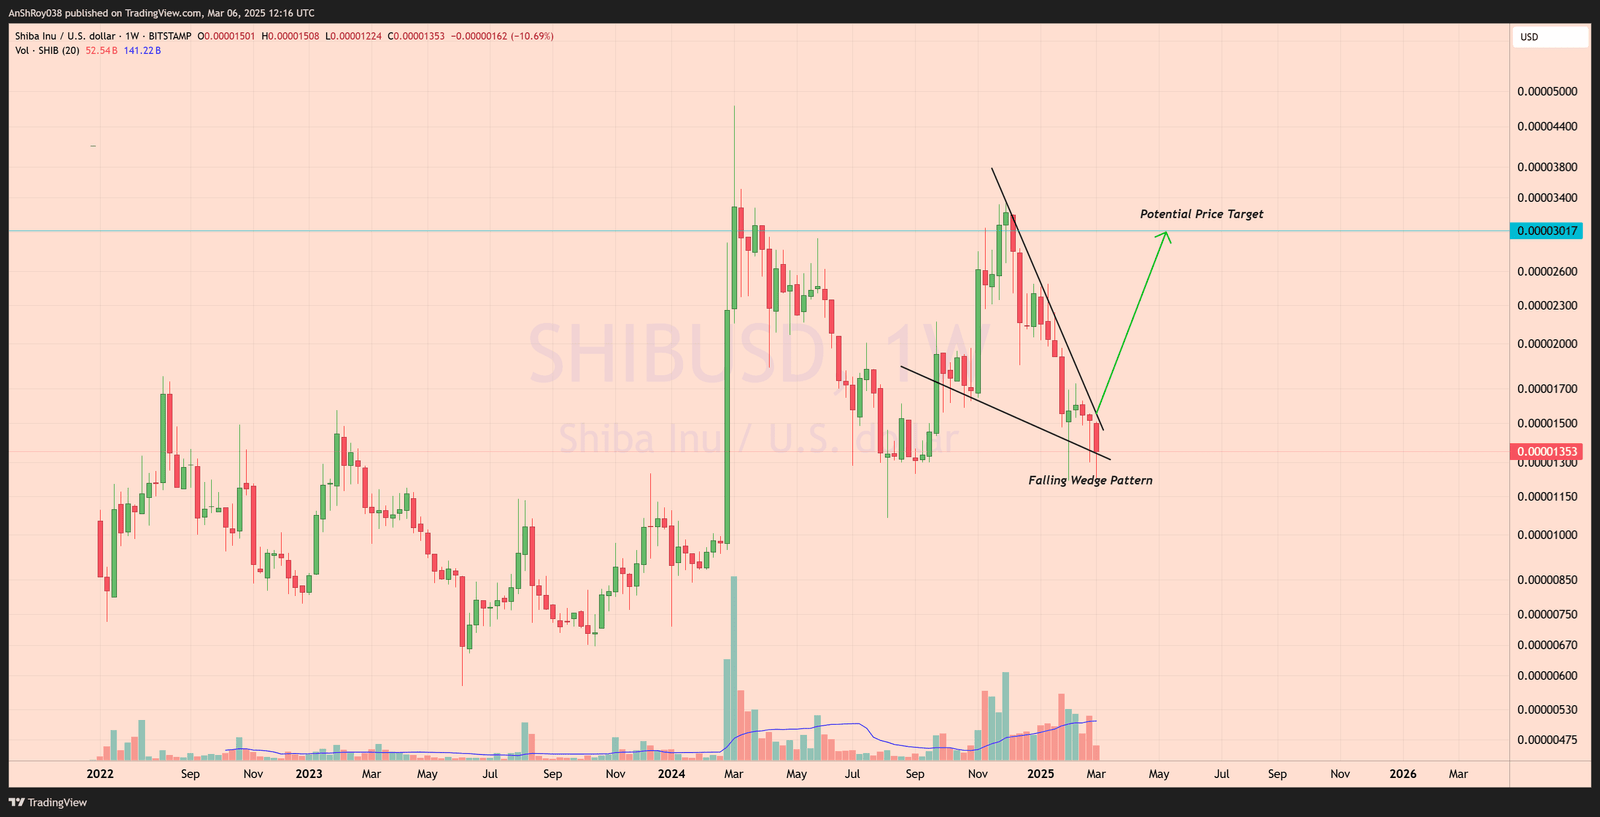
The breakout target is typically calculated by measuring the maximum height of the wedge and adding it to the breakout point. In SHIB’s case, this suggests a potential 123% move toward $0.00003, provided buying momentum sustains the breakout.
While the pattern signals a deceleration in selling pressure, derivatives data offers further insight into market sentiment. Funding rates are currently positive, indicating that long positions are paying a premium to maintain their trades.
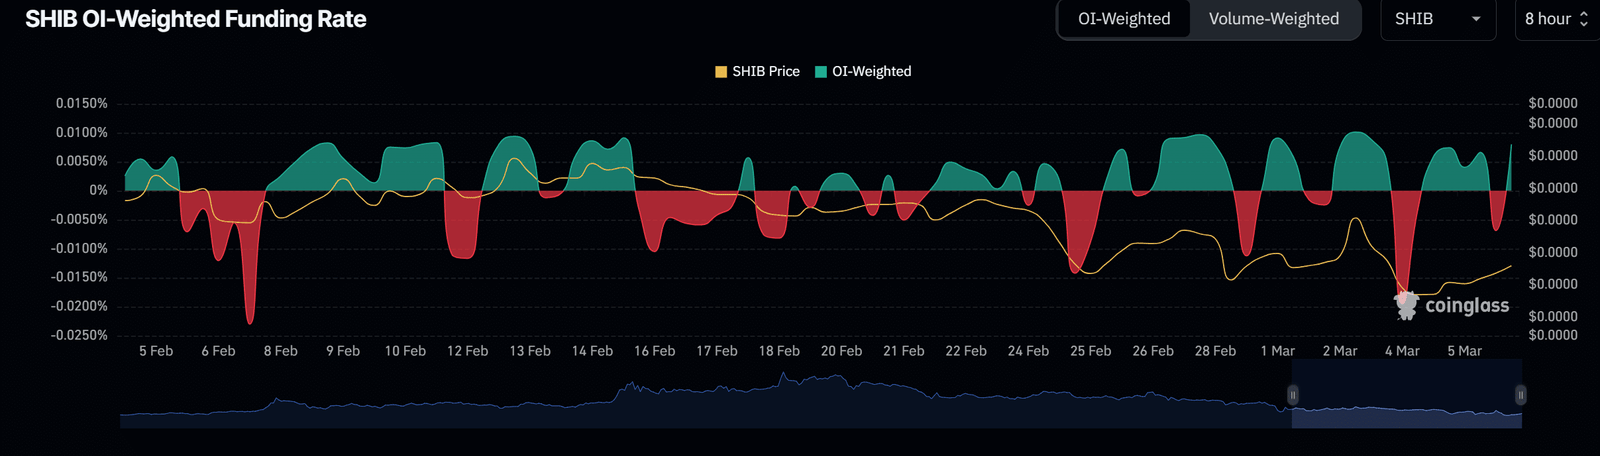
The funding rate suggests that bullish sentiment dominates the futures market, reducing the likelihood of a short squeeze but also signaling that traders are positioning for upside.
Open interest (OI) has declined from recent highs, signaling a reset in leveraged positions. A rise in OI alongside price action would confirm fresh long accumulation, reinforcing the wedge breakout’s potential. However, if funding rates rise too aggressively, it could signal overleveraging on the long side, making the market vulnerable to a long squeeze if sentiment shifts.
For confirmation, SHIB must reclaim resistance between $0.00001450 and $0.00001550. Failure to break out could result in extended consolidation or another downward move. The wedge structure and derivatives data suggest buyers hold the upper hand, but execution and volume remain critical.
No Respite In Bearish Pressure For SHIB Price
SHIB is currently trading below all major exponential moving averages (EMAs), suggesting that bears continue to make their presence felt. SHIB prices rebounded off the support near $0.0000134 on March 4, and have since been on a bull run. If the rally continues, the 20-day (red) EMA near $0.0000144 is the first key level traders must reclaim to infuse confidence in the Shiba Inu coin’s price action.
Moving beyond that would bring SHIB price close to $0.0000153, which is the next major hurdle for the memecoin. A successful breakout would push SHIB toward the 50-day (purple) EMA resistance near $0.0000166, where traders might encounter stronger resistance.
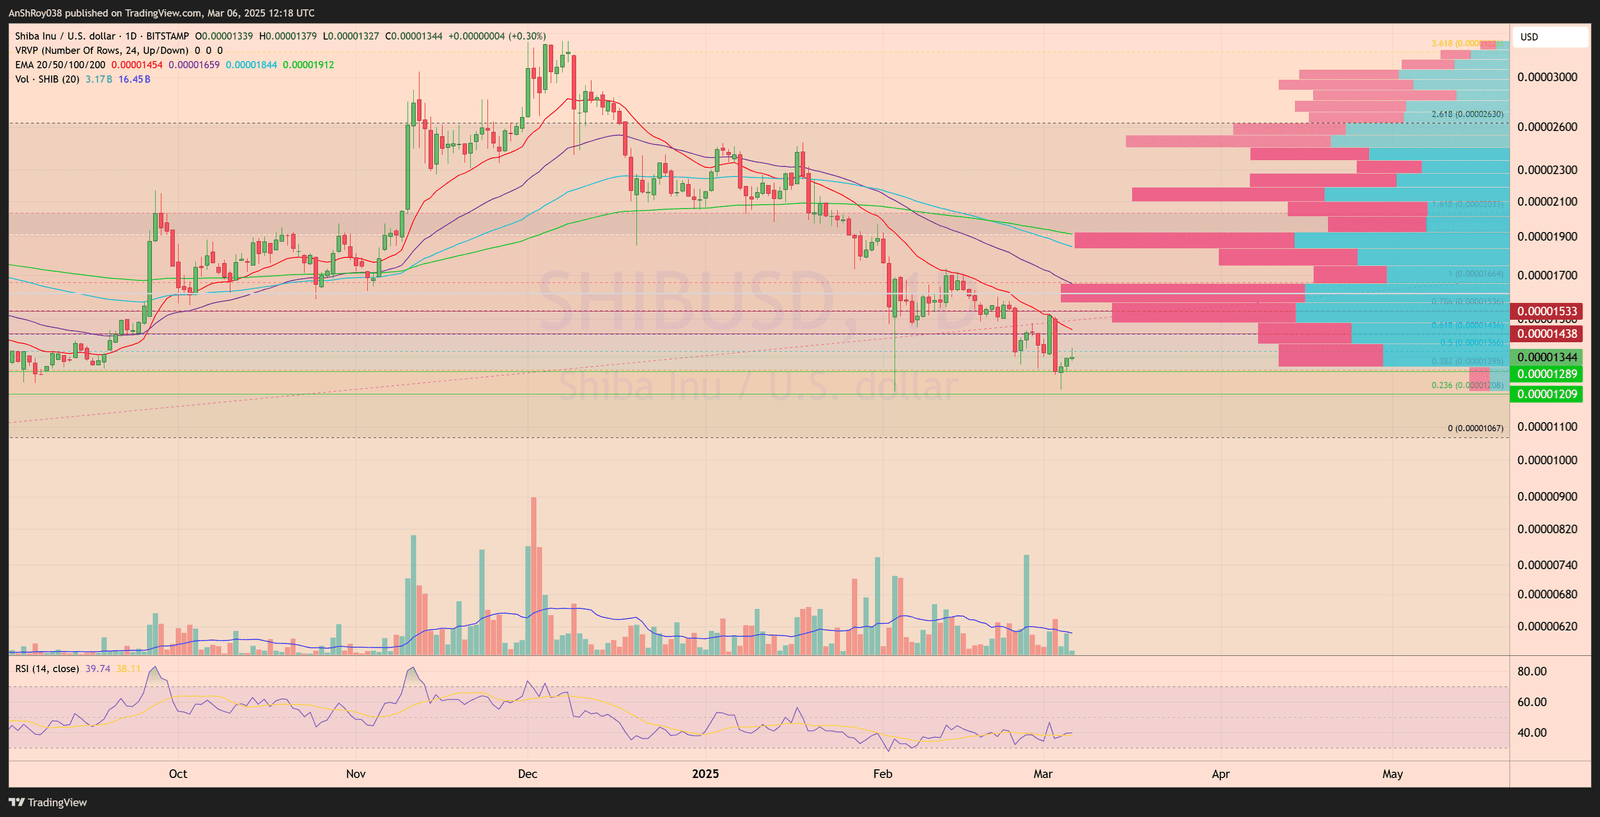
Fibonacci retracement levels further highlight $0.00001209 as strong support, aligning with the 0.236 level. Volume analysis shows thin liquidity between $0.00001289 and $0.00001344, suggesting price could move swiftly within this range.
The Relative Strength Index (RSI) at 39.74 signals that SHIB is still in bearish territory, though not yet oversold. A move above 50 would indicate strengthening momentum. The overall trend remains weak unless SHIB reclaims key resistance levels with increased buying volume. A breakout above $0.00001438 could accelerate gains, while failure to do so may lead to prolonged sideways action or another retest of lower support levels.
