
IntoTheBlock data reveals that 128.99 trillion SHIB—nearly 22% of the total supply—is held by just 45 addresses. These wallets fall into the “investors” category, defined as holding between 0.1% and 1% of SHIB’s circulating supply. The exact identity of these holders remains unclear, as IntoTheBlock does not distinguish between centralized exchanges, smart contracts, or private wallets. However, blockchain records show many top SHIB wallets belong to exchanges like Binance and Coinbase, which often pool user funds in a few cold wallets. Others are tied to Shiba Inu’s platforms such as ShibaSwap and Shibarium. As of June 19, 2025, SHIB traded at $0.00001166, up 0.01% in 24 hours, with market activity staying muted.
SHIBA INU Forms Bullish Flag, Targets 50% Upside Toward $0.00001750
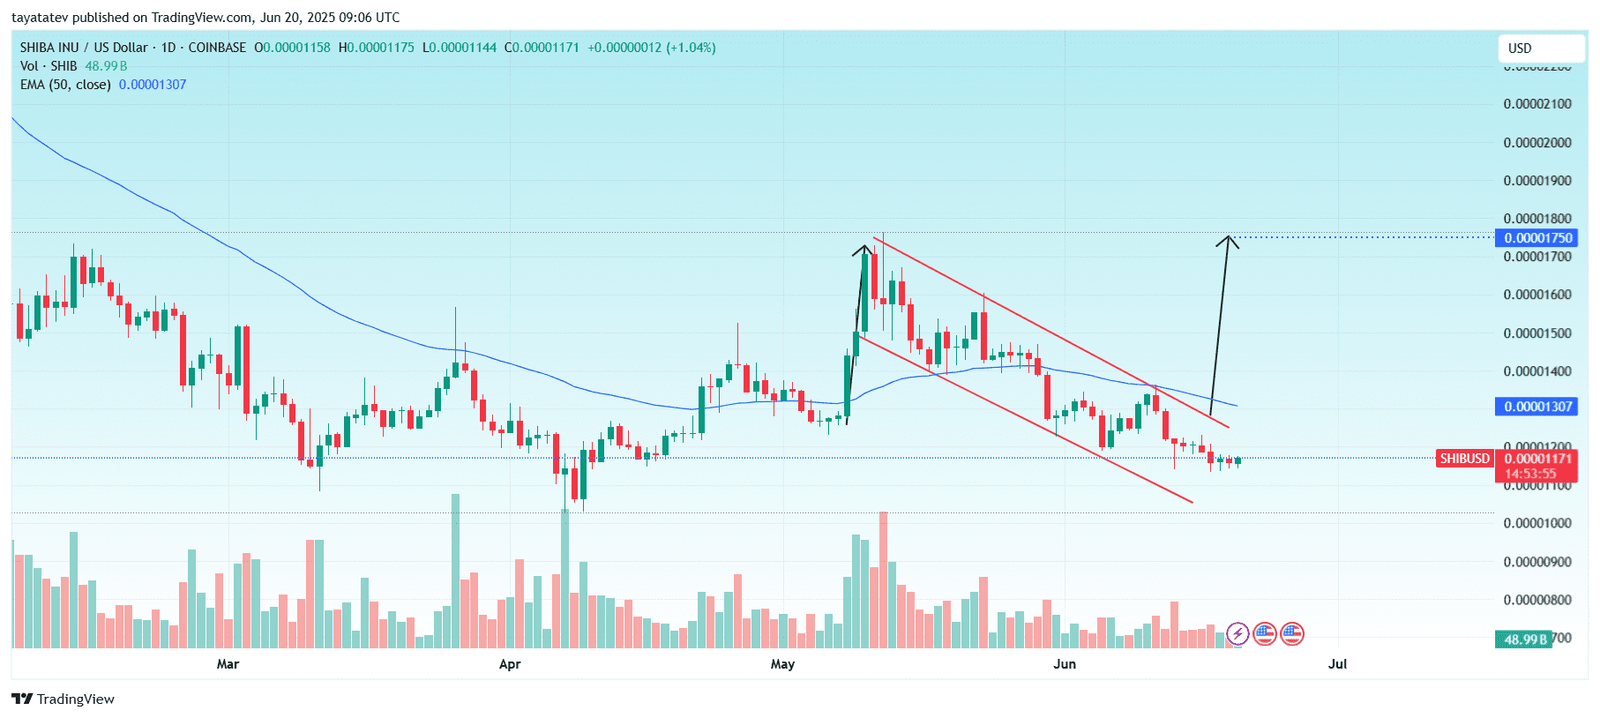
On June 20, 2025, SHIB/USDT chart data from Coinbase showed a confirmed breakout from a descending flag pattern. This structure followed a sharp rally in late April and early May, then consolidated between two downward-sloping parallel trendlines. The breakout occurred just above the 50-day EMA at $0.00001307.
A bullish flag is a continuation pattern that appears after a strong upward move, followed by a slight pullback within parallel downward lines.
This formation confirms a potential 50% price increase from the current level of $0.00001171. If the pattern plays out fully, SHIB may reach the projected target of $0.00001750.
Volume activity remained relatively stable during the pullback, a common trait in bull flags. The price now hovers just below the breakout zone, suggesting consolidation before a possible rally. If SHIB holds above the lower trendline and reclaims the EMA level, upside pressure could resume.
The next resistance lies near $0.00001307. If bulls flip this level into support, momentum may push SHIB to the flagged target around $0.00001750, completing the breakout pattern.
SHIBA INU Directional Movement Index (DMI) Signals Weak Bullish Momentum
The DMI indicator on SHIB’s chart shows the following readings:
+DI (orange): 26.44
–DI (blue): 12.71
ADX (red): 24.76
These values signal a bullish bias, as the +DI line is above the –DI line. This means upward pressure dominates. However, the ADX remains below 25, indicating weak trend strength.
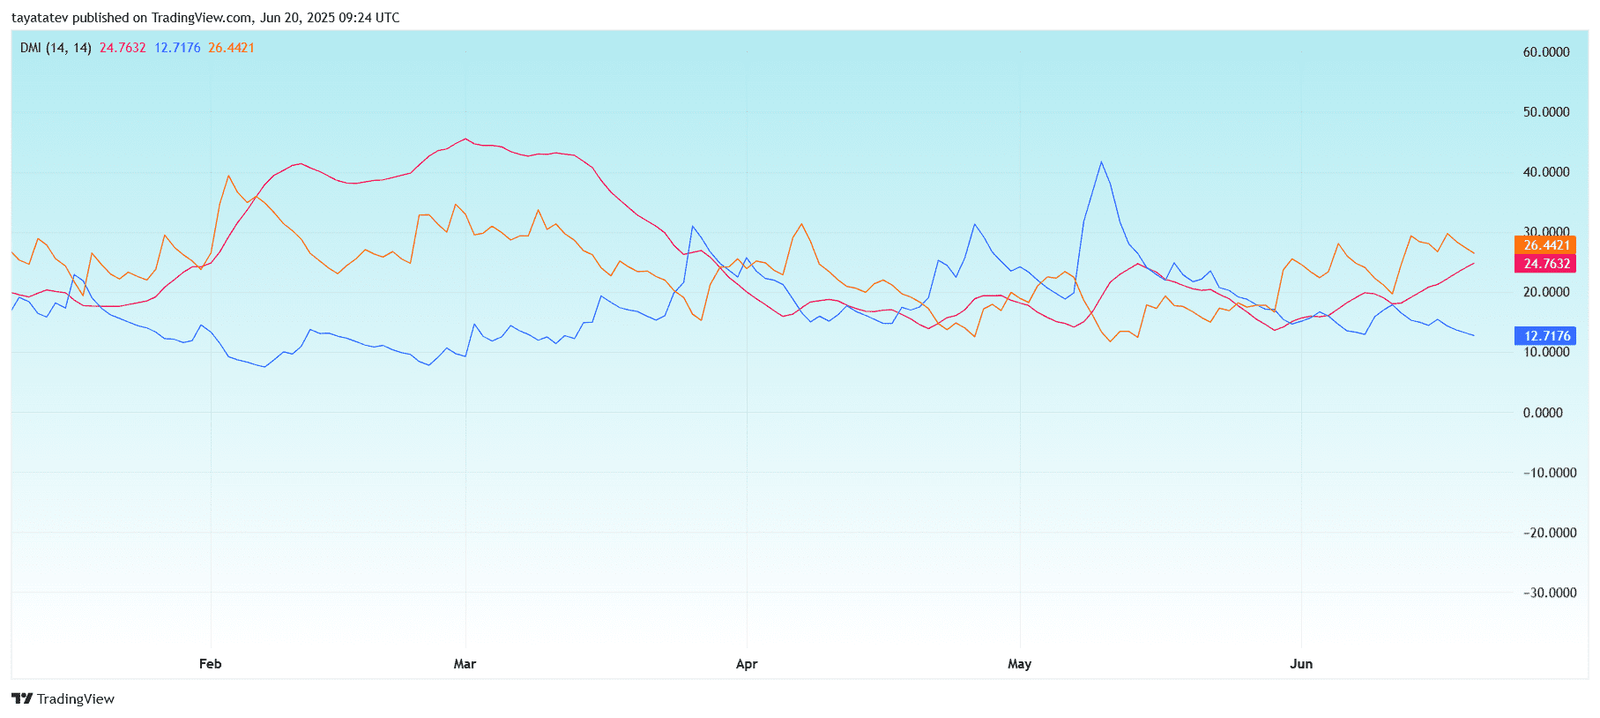
Throughout June, the +DI has gradually risen while the –DI declined, confirming growing buying interest. Yet, since the ADX only recently approached 25, the current trend lacks strong momentum. If the ADX continues climbing, it could confirm a stronger bullish move.
In summary, SHIBA INU shows early signs of a bullish trend, but it needs stronger ADX confirmation before a major directional breakout.
SHIBA INU RSI Near Oversold Zone, Signals Weak Buying Pressure
As of June 20, SHIBA INU’s Relative Strength Index (RSI) sits at 36.97, while its RSI-based moving average tracks at 39.84. The RSI remains below the neutral 50 level and is approaching the 30 threshold, which marks the oversold zone.
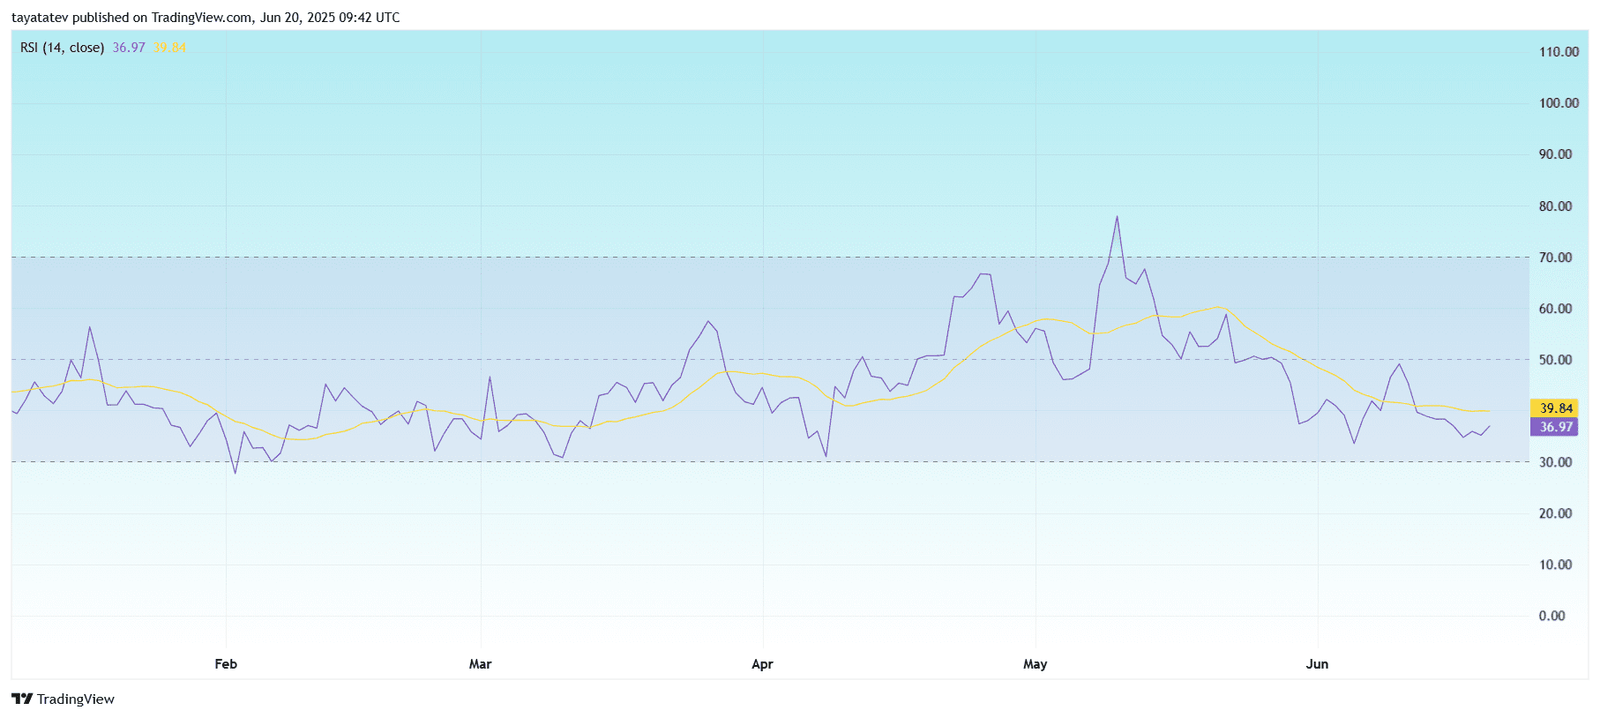
This low RSI reading suggests that SHIB is currently experiencing weak buying momentum. For most of June, the RSI trended downward, mirroring reduced price strength. Although the current level is not yet oversold, it indicates that sellers still dominate.
If RSI drops below 30, it may trigger increased interest from buyers anticipating a reversal. For now, SHIB’s momentum remains bearish, with no strong divergence or uptick showing immediate recovery.
