
Key Takeaways:
- Users can now monitor real-time emissions on the Solana blockchain
- SOL price rallied after news of the announcement hit the wire

NEW DELHI (CoinChapter.com) — Solana has become the latest blockchain platform to take a step towards becoming an environment-friendly network. The PoS-based blockchain has launched a real-time feature to track its carbon footprint.
Environmentalists and the anti-crypto squad have often highlighted the sector’s impact on the environment. Most blockchain networks consume massive amounts of electricity to operate their servers.
Since coal thermal power plants remain the major source of electricity globally, increased electricity consumption negatively impacts the environment. Hence, in the interest of transparency, Solana has decided to become the “first major smart-contract blockchain” to measure its carbon footprint in real life.
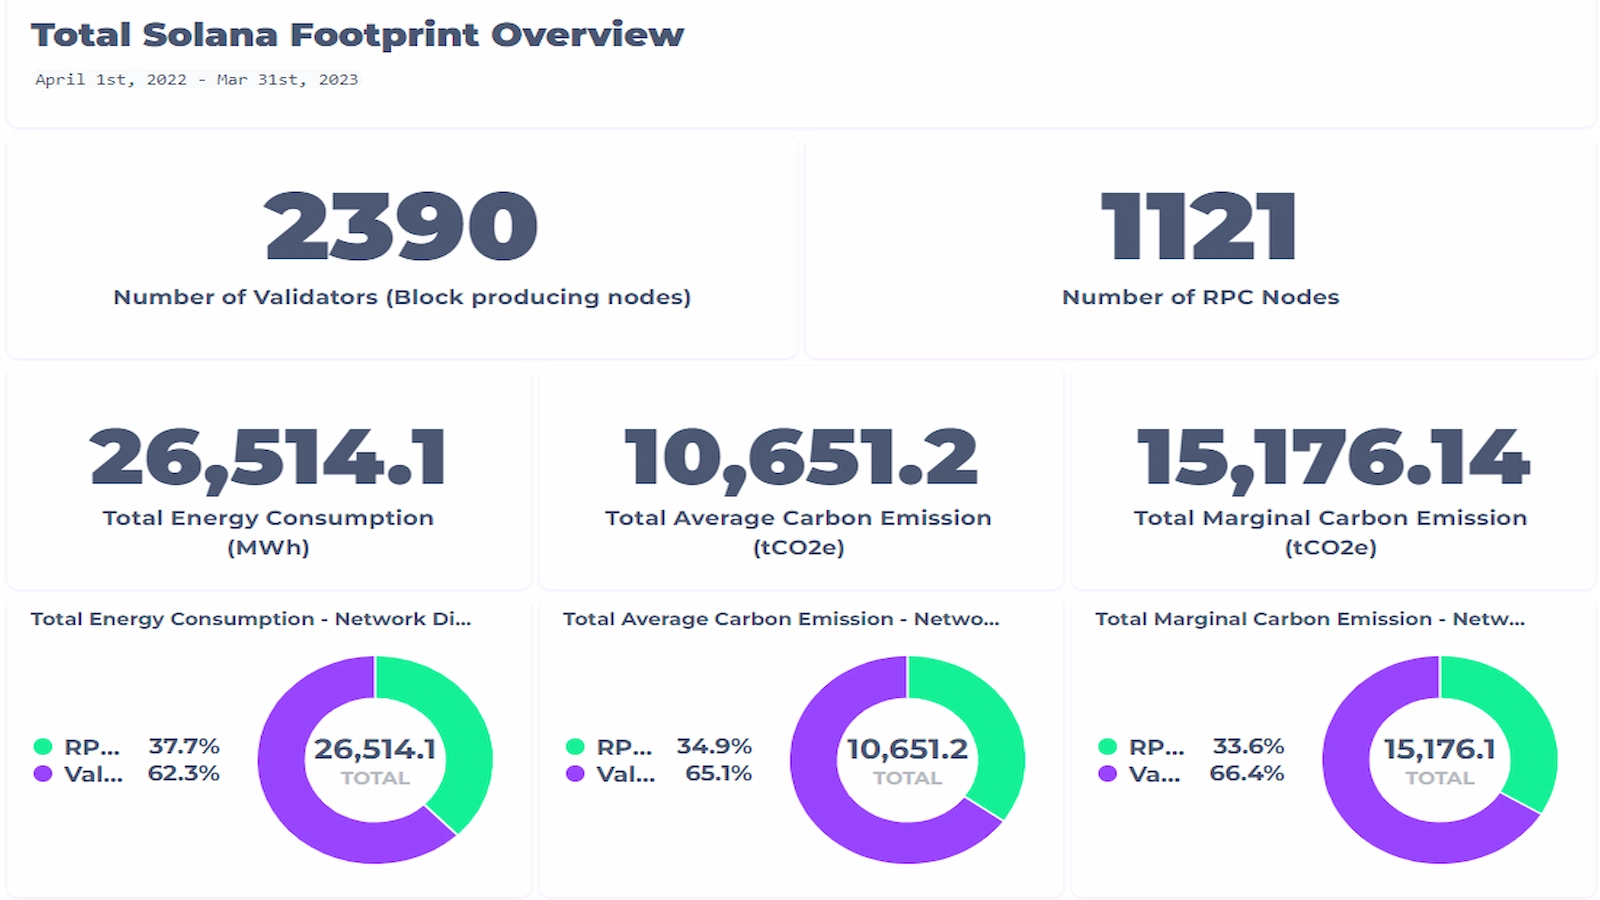
Solana developed the emission tracker in collaboration with Trycarbonara, a carbon data platform. The tracker would measure the emissions of RPC nodes, marginal emissions, and power usage consumption, among other metrics.
Interestingly, the platform stated that one Solana (voting + non-voting) transaction has a smaller footprint (0.878 kJ) than one Google search.
SOL Price Moving Inside Bullish Pattern
Meanwhile, SOL price has formed a bullish technical pattern called the ascending triangle. A horizontal trendline that connects swing highs and an ascending trendline connecting swing lows forms the pattern. Volume helps determine if a breakout is strong.
Also Read: US Scarily Behind European Union on Crypto Licensing Laws — Gary Gansler RoastedIn an ideal world, buyers would enter the market as the trendlines close the gap, pushing prices above horizontal resistance with heavy volumes. Unfortunately, a low-volume breakout on the upside will likely fail, resulting in a pullback.
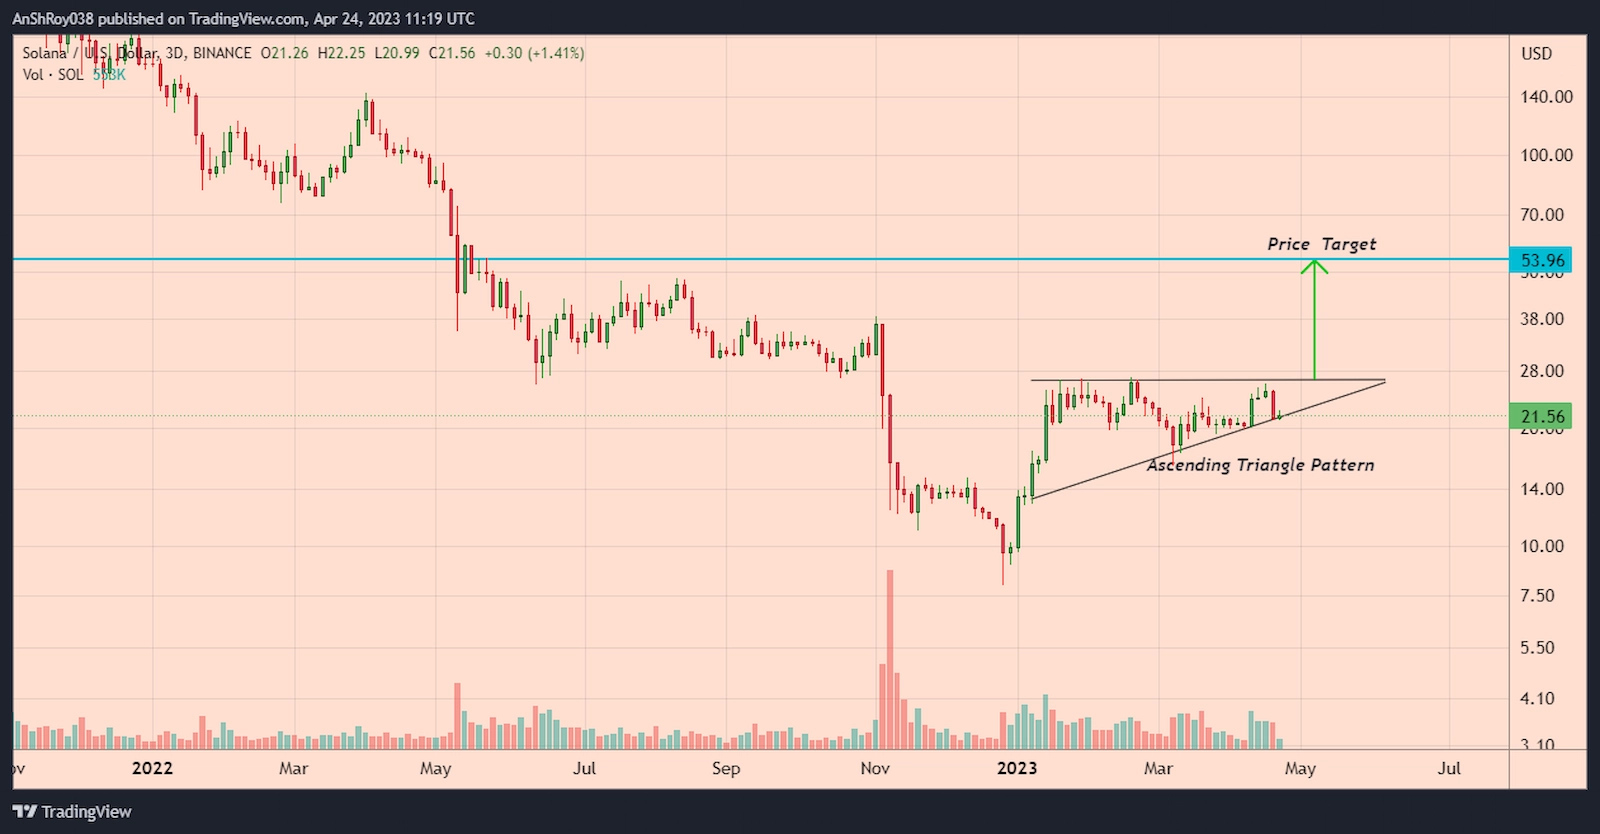
Per the rules of technical analysis, the price target for a breakout is equal to the triangle’s height at its thickest point. Therefore, the SOL price might jump 150% from its current levels to reach $54 after confirming the pattern.
However, bulls remain largely absent from SOL markets despite news of Solana’s green initiative. SOL price has been crabbing below its 20-day EMA (red wave) and 50-day EMA (purple wave) trendlines.
Moreover, the momentum oscillator MACD is projecting bearish signals for SOL. Negative bars on the MACD histogram, which charts the difference between the MACD line (difference between 12-day and 26-day EMA) and the MACD signal line (9-day EMA of MACD), are expanding.
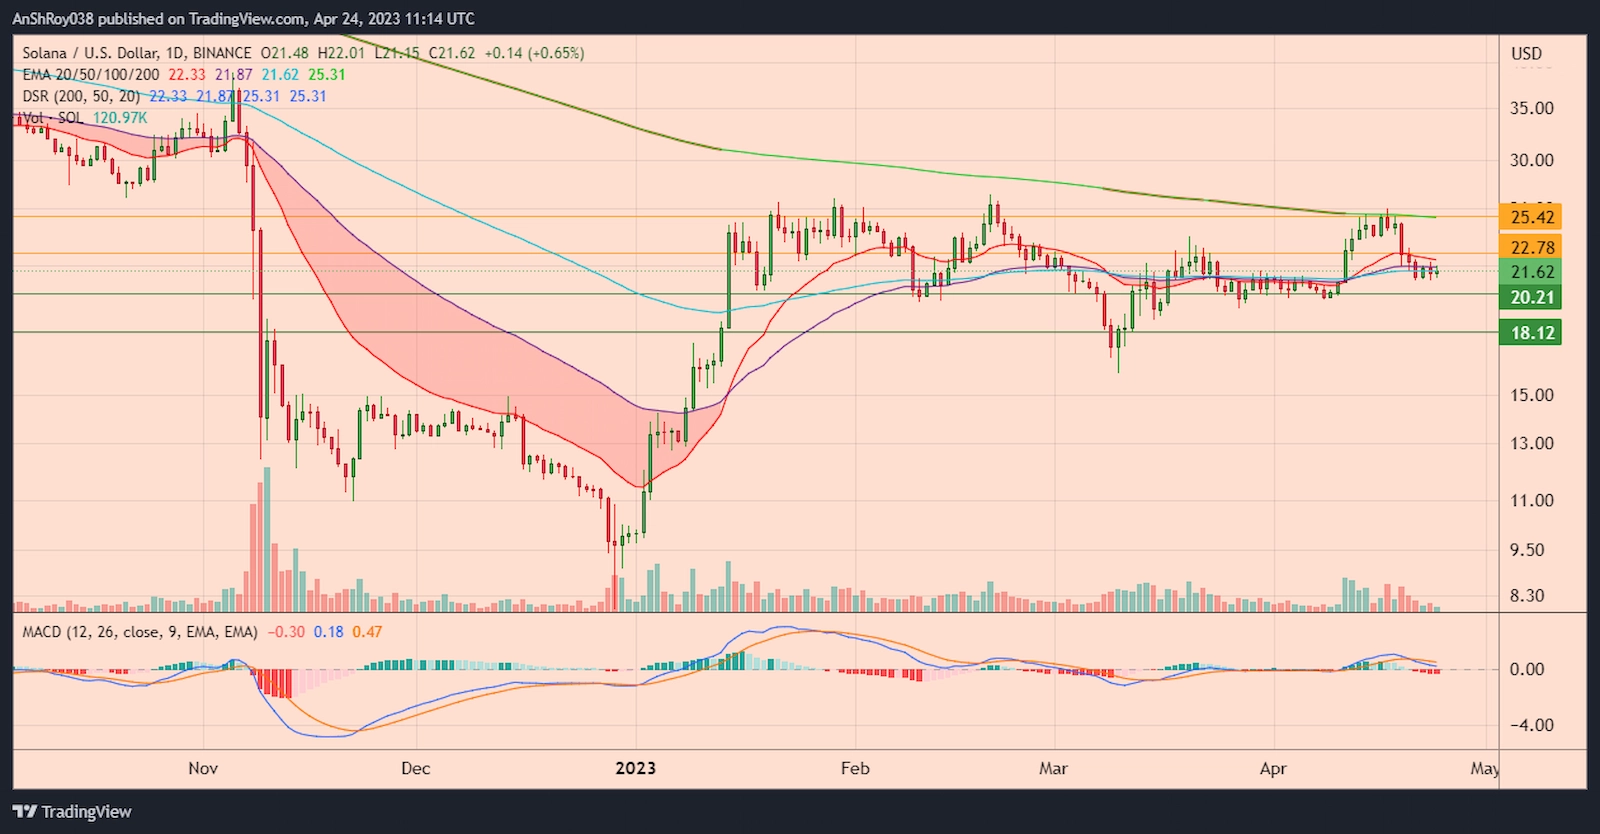
If the Solana token price fails to rally upward, the SOL price might drop to its support near $20. Furthermore, breaching the immediate support level might force the Solana token price to test support near $18 before recovering.
Conversely, if bulls enter the market, SOL price might rise to the resistance near $23. Additionally, breaking and consolidating above the immediate resistance could help the Solana token price challenge its 200-day EMA (green wave) resistance near $25.4 before retreating.

… [Trackback]
[…] There you will find 74380 more Information on that Topic: coinchapter.com/sol-bulls-unimpressed-with-solanas-green-initiative-price-crabs/ […]
… [Trackback]
[…] Read More on to that Topic: coinchapter.com/sol-bulls-unimpressed-with-solanas-green-initiative-price-crabs/ […]
… [Trackback]
[…] Find More to that Topic: coinchapter.com/sol-bulls-unimpressed-with-solanas-green-initiative-price-crabs/ […]