
MANALI (CoinChapter.com) — Terra Labs’ native token LUNA reached a new price milestone on Wednesday as it reached a new record high of $109.05 for the first time.
The uptrend also helped LUNA reverse its losses from the Dec 2021 to Feb 2022 downtrend. Moreover, LUNA’s new ATH means the token’s prices are now up by more than 150% from their 2022 low of $43.5 (reached on Jan 31, 2022).
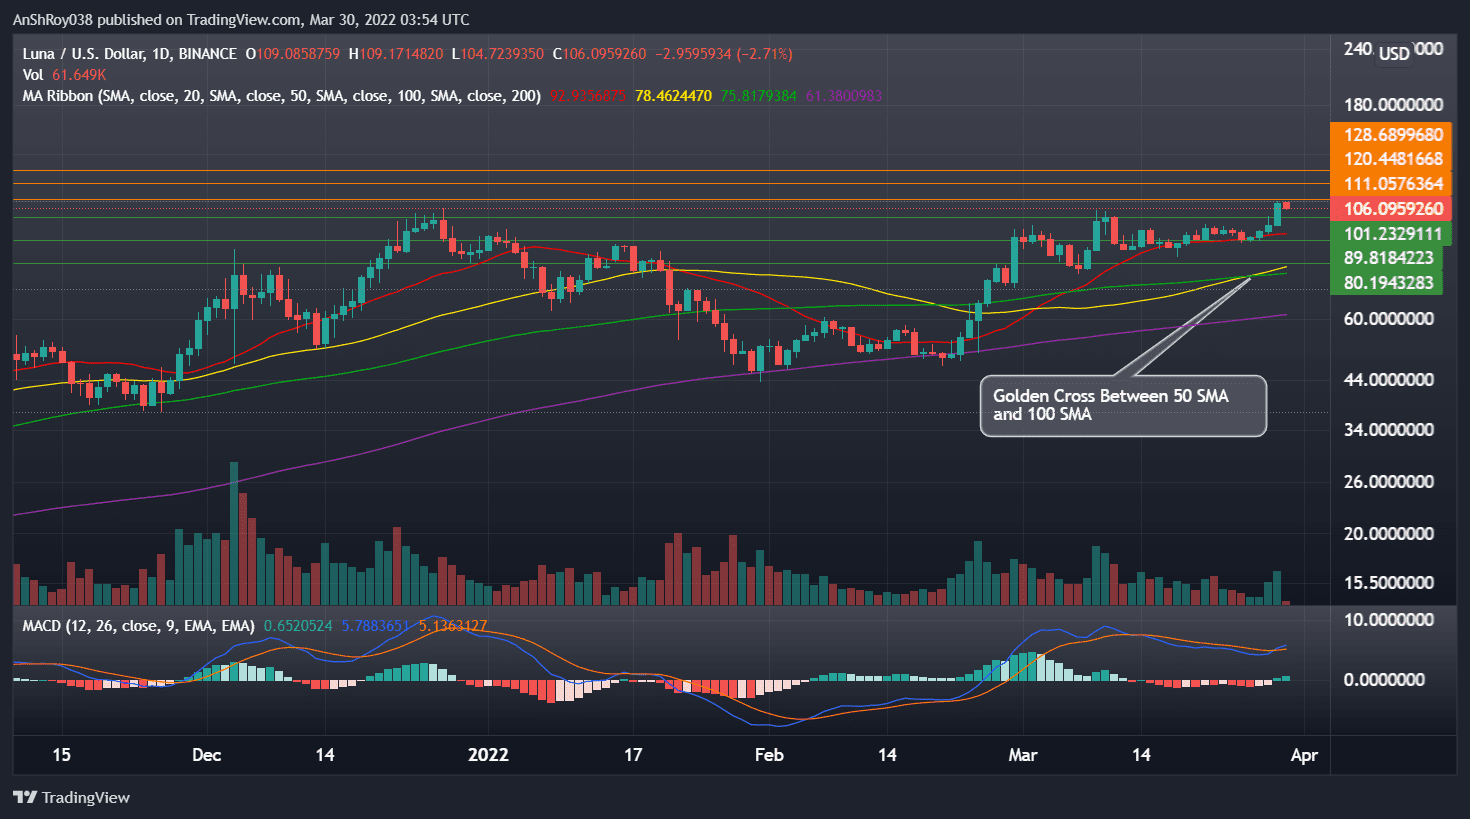
In addition, LUNA’s 50-day Moving Average (yellow wave) moved above its 100-day MA (green wave) to form a bullish pattern called a golden cross. A golden cross is a bullish technical signal that forms when a short-term MA line moves above a relatively long one.
Traders and analysts usually interpret the pattern as an indicator of a definitive uptrend in the market.
Terra’s recent uptrend took cues from news of the Luna Foundation Guard’s (LFG) decision to increase its Bitcoin reserves to back its stablecoin TerraUSD (UST). UST is a decentralized stablecoin pegged to the US Dollar and collateralized by Terra’s LUNA token.
LUNA helps absorb the volatility of the Terra Stablecoin, with the UST minting mechanism involving the burning of LUNA tokens.
Related: Bitcoin-pegged stablecoins? Terra (LUNA) says yes and buys up $125M in BTC.Meanwhile, momentum oscillator MACD charted a bullish crossover for LUNA. The pattern forms when the MACD line (difference of 12-day and 26-day EMA) moves above the MACD signal line (9-day EMA of MACD), indicating a reversal of momentum from bearish to bullish.
LUNA prices could see further upside movement, driven by the above bullish cues. The token would try to flip immediate resistance near $111 before moving to challenge resistance near $120, charting a new ATH.
LUNA Forms Ascending Triangle Pattern
The Terra token has formed a technical continuation pattern called the Ascending triangle. The pattern forms when an asset’s price consolidates between a rising trendline connecting higher lows and a horizontal upper trendline.
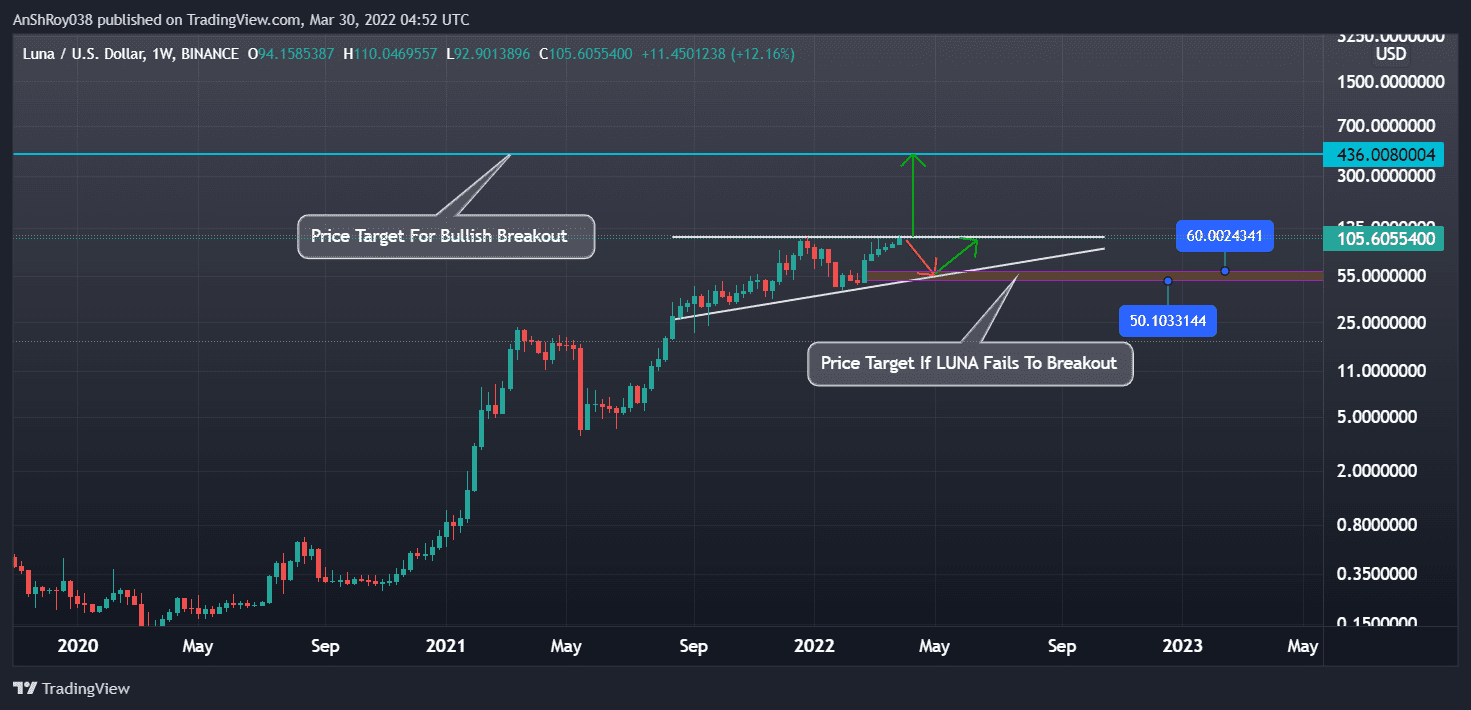
In the case of a breakout, the price target equals the maximum distance between the pattern’s upper and lower trendline added to the breakout level. Hence, LUNA’s prices could rise to around $436, nearly 313% from current levels.
Conversely, if the breakout is not decisive, it would invalidate the upside outlook, resulting in LUNA prices pulling back to support near the pattern’s lower trendline. As a result, the Terra token could fall to support between $50-$60, a fall of nearly 42%-52% from current prices.
Also Read: Terra eyes a new record high after LUNA’s 35% rally in 48 hours.With bears moving in to book profits from LUNA’s recent rally, it seems unlikely the token would continue moving upwards.
Downside Risks Remain
LUNA’s relative strength index pulled back from the overbought boundary on Wednesday. Traders often consider an overbought RSI a prelude to an upcoming trend reversal in bears’ favor. As such, overbought RSI levels often trigger sell-offs.
The Terra token’s RSI is neutral, clocking 64.38 on the daily charts.
Furthermore, LUNA’s Bollinger bands also forecast an overbought condition for the token.
In detail, Bollinger bands consist of a simple moving average (middle band) and an upper and lower band. The two bands are usually two standard deviations from the middle band. Therefore, when an asset’s prices break above the upper bands, it denotes an overbought condition.
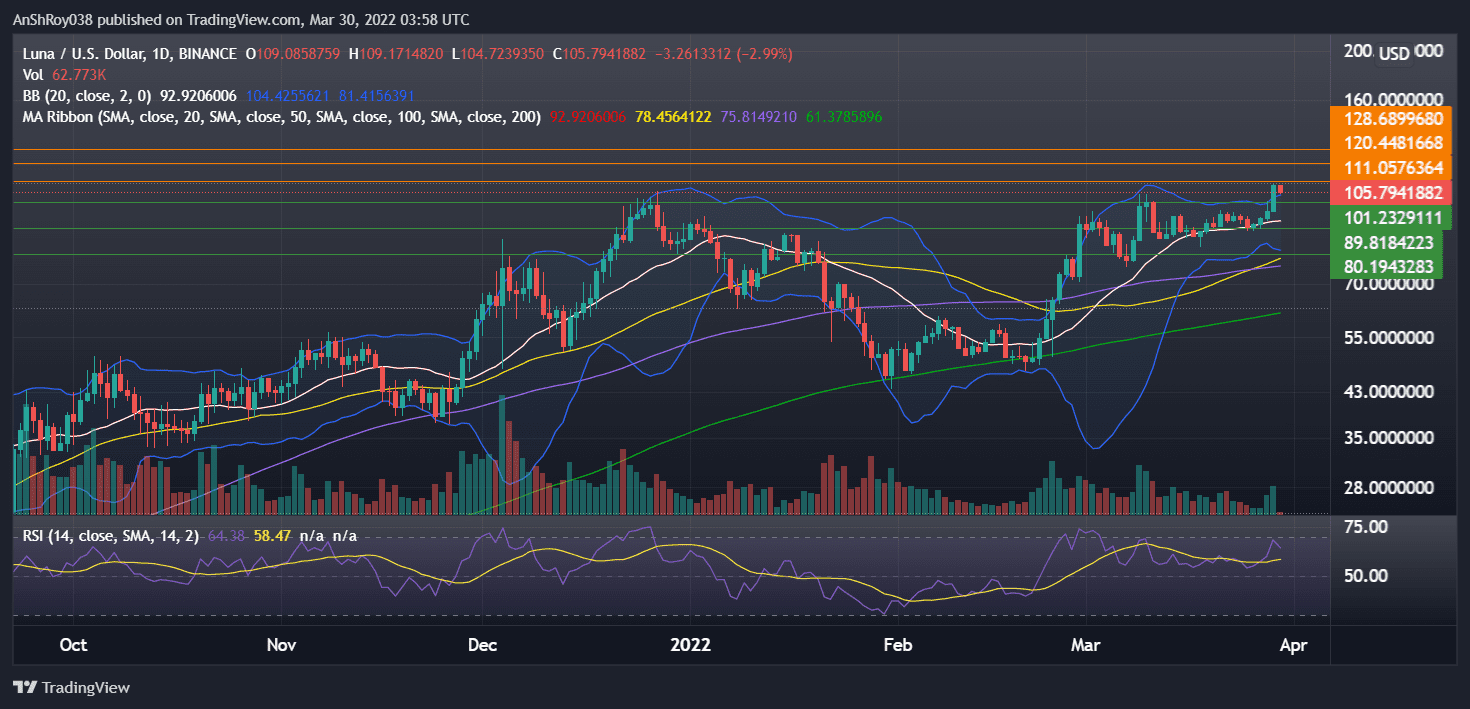
LUNA prices broke above the upper Bollinger trendline on Mar 29, making the token overbought and likely triggering a pullback. If LUNA continues moving downward, the token will fall to support near $101, which acted as resistance for Terra between Mar 9 to Mar 29.
Further downside movement would see LUNA fall to support near the 20 day MA (white wave) at $90. Finally, LUNA has support coming from the lower limit of the Bollinger bands and the 50-day MA (yellow wave) near $80.
At the time of writing, LUNA was trading at $105.1, down 2.82% on the day.

… [Trackback]
[…] Read More to that Topic: coinchapter.com/terra-hits-new-ath-after-luna-jumps-nearly-46-in-march/ […]