
YEREVAN (CoinChapter.com) – After 2022 shaved over $2 trillion off the crypto market’s total valuation, 2023 brought a relief rally to Bitcoin and the gang. However, several digital assets outpaced the flagship crypto by a long shot, including Gala (GALA), Decentraland (MANA), Solana (SOL), STEPN (GMT), and Lido DAO (LDO), posting three-digit gains.
#1 Gala (GALA) rallied 250% but might pare some of the gains
Gala emerged as one of the top gainers in 2023, with a 250% rally, peaking at $0.055 on Jan 14. The token partially pared its gains since and stood at $0.047 on Jan 16, maintaining a 200% uptrend year-to-date.
As mentioned, 2022 did not bode well for GALA, as the token lost over 95% of its annual valuation. However, as CoinChapter covered in the previous Gala review, the token has traded within a bullish ‘falling wedge’ pattern since May 2022.
The latter consists of two dropping trendlines that connect the swing highs and the swing lows and gradually lower the price through consecutive support and resistance retests. Moreover, the expected surge would equal the maximal setup height, pinning the target price for GALA at $0.077, or another 60% higher than the current value.
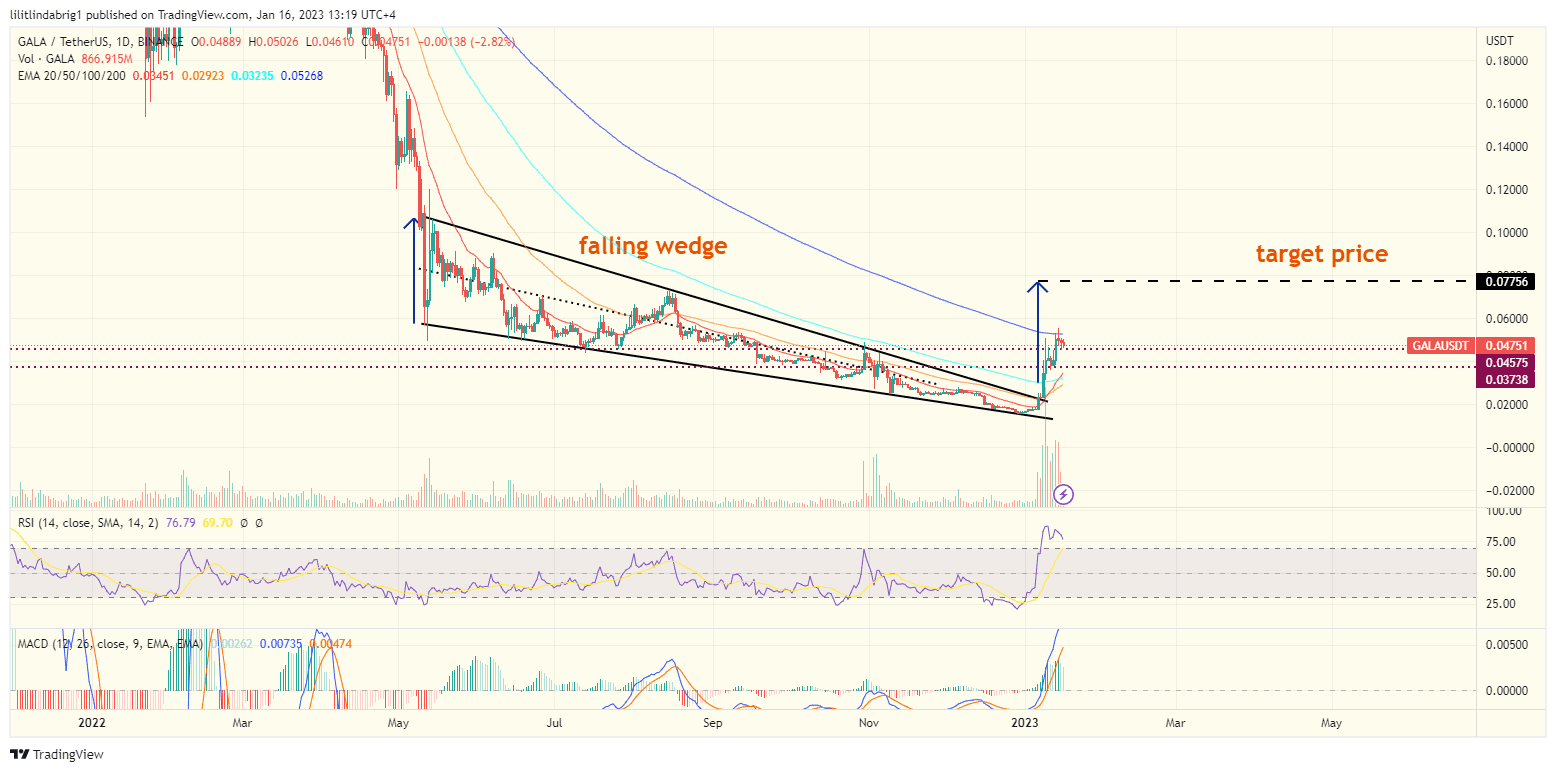
Notably, GALA confirmed the formation by breaking above the resistance trendline on Jan 6. However, a 60% additional rally seems unlikely in the upcoming few sessions, as the bullish push weakened in the previous hours, hinting at a cool-off rather than another leg up.
With that said, another 60% rally is NOT out of the question, especially if BTC prints more green candles. However, lowering trading volumes on multiple charts indicates that traders would rather take profits than risk their recent gains, and GALA was no exception. Thus, short-term prediction is a coll-off, with support at the $0.045 level and another possible assistance at $0.037.
Also read: 3 Reasons Why GALA Has Skyrocketed 140% in a Week.
#2 Decentraland (MANA) investors reaped three-digit gains and stood back.
As mentioned earlier, on Jan 16, Decentraland joined the ‘winning parade’ and yielded 150% gains to its investors year-to-date. As a result, the MANA price stood at $0.69 on Jan 16. However, the Decentraland daily chart also showed a looming cool-off and a possible drop to $0.63 ahead. In addition, the ‘overbought’ relative strength index intensified the bearish expectations.
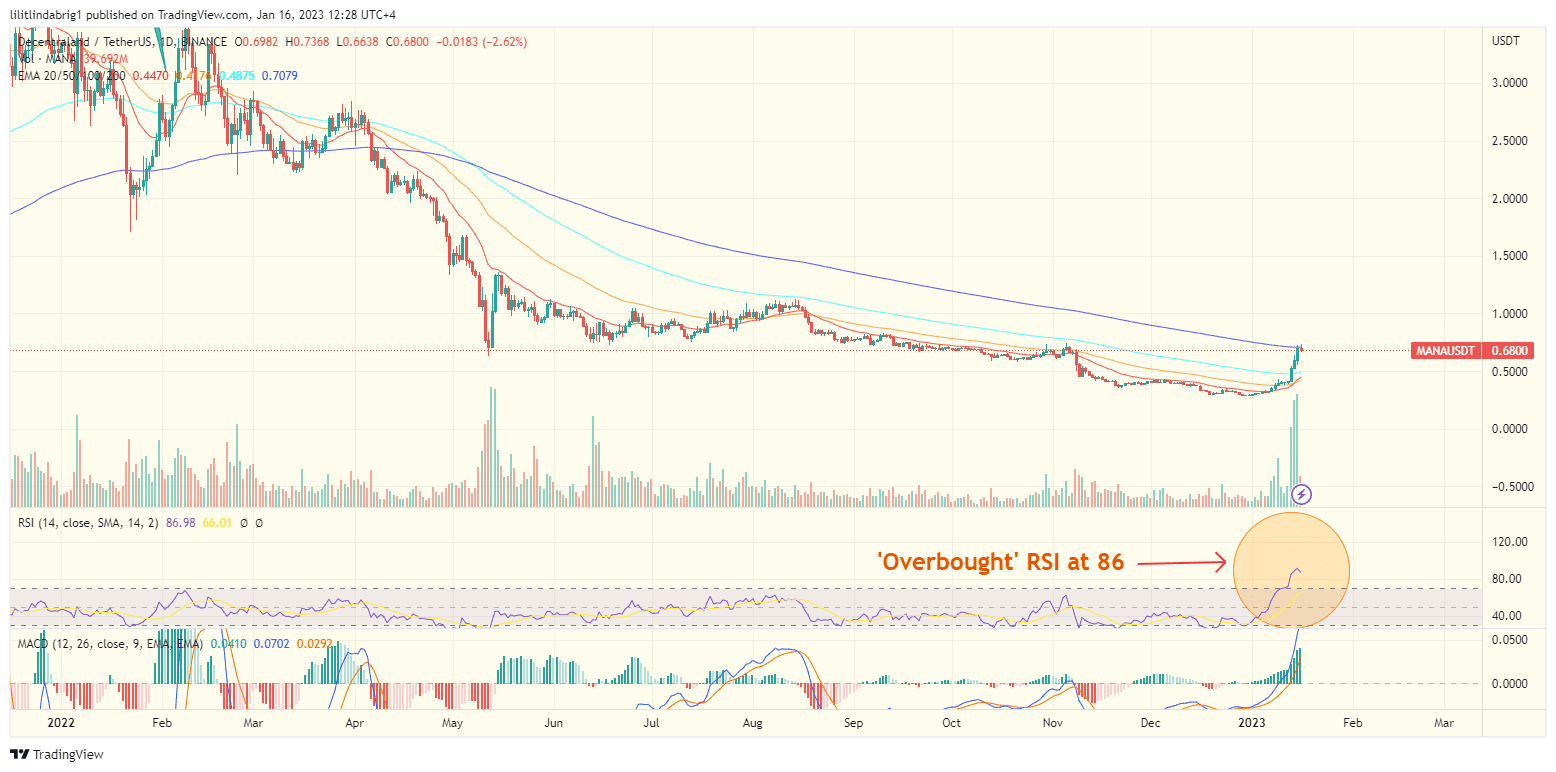
In short, the RSI is a momentum indicator that serves as a gouge for the best market entry and exit points. Traders typically construe the oscillator’s drop below its ‘normal’ 30-70 range as a BUY sign and move in. Conversely, when the RSI elevates above 70, it flashes a warning sign, deeming the asset ‘overbought.’ Traders looking for additional oscillator cues could interpret MANA’s 86 RSI as a good time to profit.
Coupled with the declining trading volumes, the overbought RSI could result in a selloff in the upcoming sessions. If so, the MANA price could decline to $0.55 if the $0.63 support is not strong enough.
#3 Is Solana (SOL) likely to break the resistance?
Solana (SOL) price stood at $23.2 on Jan 16, after an over 143% rally year-to-date. However, the SOL charts hinted at a looming decline, much like its peers mentioned above. In detail, the SOL/USD price action fluctuated within a bearish ‘descending triangle’ in Q2-Q4 2022. The formation entails a dropping resistance line and flat support that prevent sharp moves in either direction.
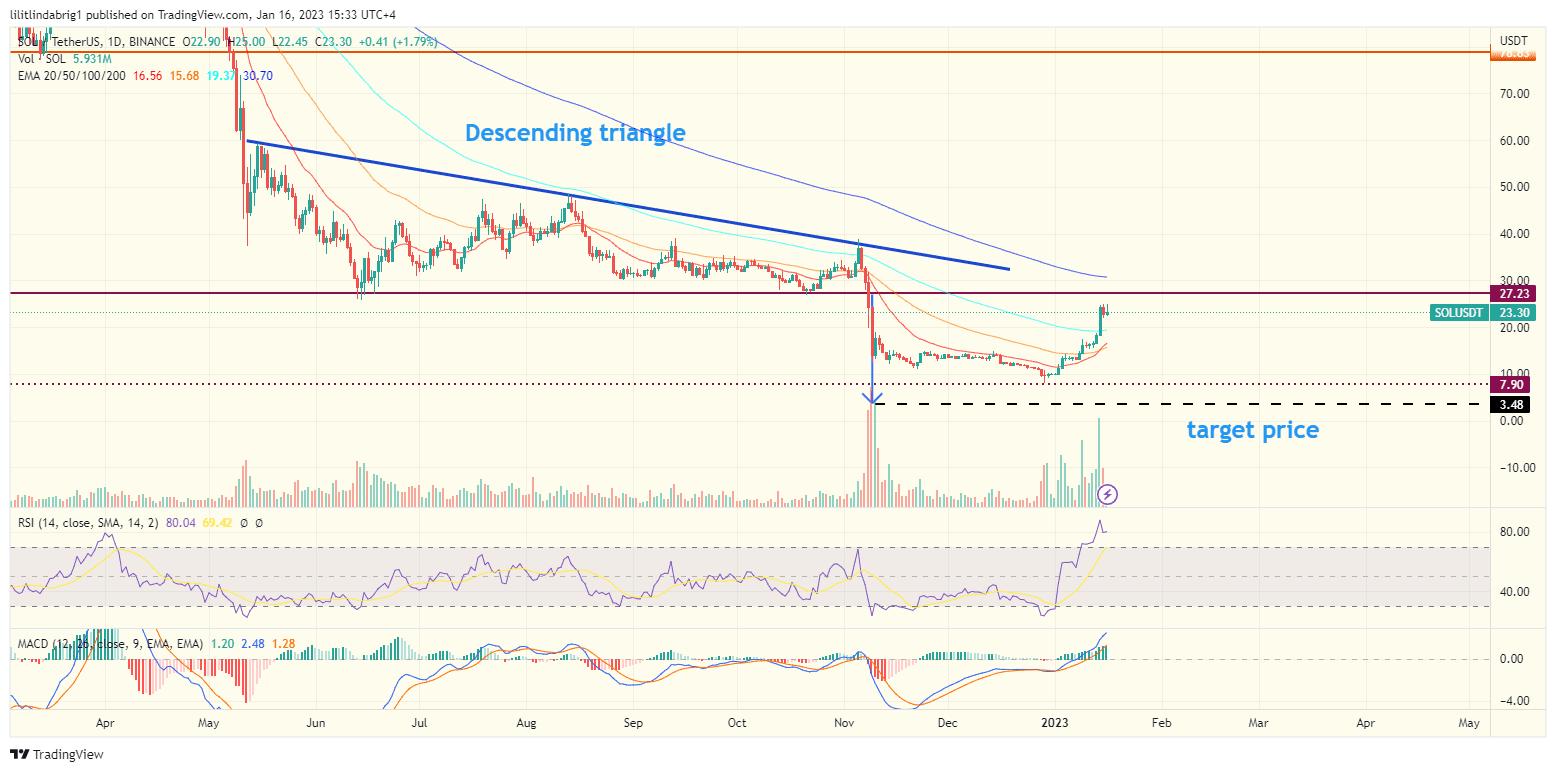
SOL confirmed the bearish setup on Nov 8 by breaking below the support. Thus, the target decline equals the maximal price swing within the triangle, pinning the expected price close to zero. Notably, the three-digit rally was not caused by fundamental developments on the blockchain. Rather, Solana followed Bitcoin’s bullish example. If that’s the case, an autonomous bullish continuation does not seem likely.
Also read: SOL Price (Solana) Aims Reversal And Might Climb To $25.
If Bitcoin loses momentum, so will Solana, reiterating the earlier prediction. However, the upcoming sessions will shed more light on the expectations. Meanwhile, the altcoin still traded over 90% below its all-time high.
#4 Workout app STEPN (GMT) looks bearish after a 150% rally
Stepn (GMT) exhibited a similar pattern to the other altcoins mentioned in the review. The GMT/USDT exchange rate surged 150% year-to-date, bringing the GMT price to $0.50 on Jan 16. However, the rally dampened in the previous two days, hinting a possible reversal after the cool-off.
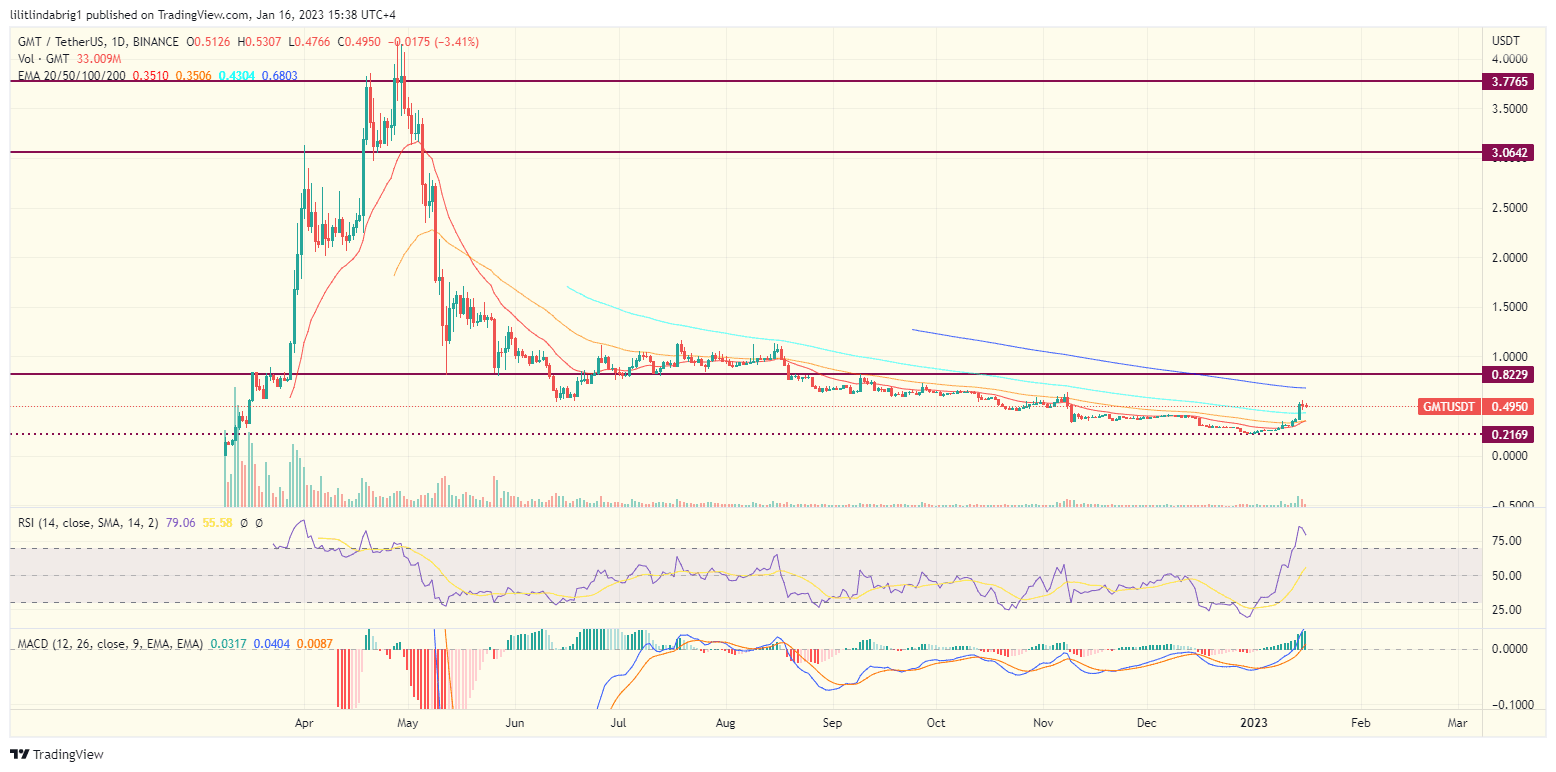
The digital asset still traded above its 20,50, and 100-day exponential moving averages (EMA; multi-colored waves on the chart above). However, the declining trading volumes and the heavily overbought RSI are likely to back the STEPN bears. If so, the GMT token’s short-term target would be a previous resistance of $0.40. Meanwhile, despite the uptrend, GMT still traded 90% below its Apr 2021 peak.
#5 Lido DAO (LDO) reached its target price. What’s next?
Lido DAO token LDO traded at $2.1 against the dollar on Jan 16 after a 140% rally. Like the assets mentioned above, LDO consolidated sideways on Jan 16, printing a red candle on the daily chart. Moreover, questions about the token’s upcoming vector became more valid as LDO/USD price action completed its falling wedge formation, much like GALA.

LDO entered the pattern in late July 2022 and confirmed it on Jan 1 by breaking above the resistance. Moreover, the token reached its goal price of $2.3 on Jan 15. However, as mentioned, the rally fizzled out, pushing the LDO price lower. If the bearish trend continues, LDO could reach the next support line at $1.8.
Also read: Bitcoin Price Breakout Looks Real, and BTC Could Attract More Buyers.
Additionally, as mentioned above, the similar patterns on multiple altcoin charts suggest that the price bounce was Bitcoin-driven. If so, all the digital assets mentioned above will copy the alpha crypto. Thus, traders should take notice of the BTC/USD chart, before making a solid investment decision on either of the coins, even in the short term.
Click here to keep up with the ever-changing crypto market and never miss the scoop!

… [Trackback]
[…] Info on that Topic: coinchapter.com/these-five-crypto-assets-have-rallied-over-100-in-2023-so-far/ […]
… [Trackback]
[…] Info on that Topic: coinchapter.com/these-five-crypto-assets-have-rallied-over-100-in-2023-so-far/ […]
… [Trackback]
[…] Information on that Topic: coinchapter.com/these-five-crypto-assets-have-rallied-over-100-in-2023-so-far/ […]
… [Trackback]
[…] Find More Info here on that Topic: coinchapter.com/these-five-crypto-assets-have-rallied-over-100-in-2023-so-far/ […]
… [Trackback]
[…] Find More on that Topic: coinchapter.com/these-five-crypto-assets-have-rallied-over-100-in-2023-so-far/ […]