

Key Takeaways:
- Both Polkadot and dYdX have token unlocks in the current quarter.
- DOT might see formula adjustments to ensure staking capacity.
- dYdX price action hinges on v4 implementation.
NEW DELHI (CoinChapter.com) — Crypto platforms Polkadot (DOT) and dYdX (DYDX) have token unlocks lined up in Q4 2023, which could spell a bearish climate for both the tokens in the near future.
Token unlocks are events that refer to the release of a certain amount of crypto assets that the projects had locked or banned from circulation. They often have a significant impact on the underlying asset’s price action since they increase the supply of the token.
Furthermore, traders whose token holdings get unlocked usually start booking profits, increasing the selling pressure. As a result, market participants view the occurrence as a bearish signal.
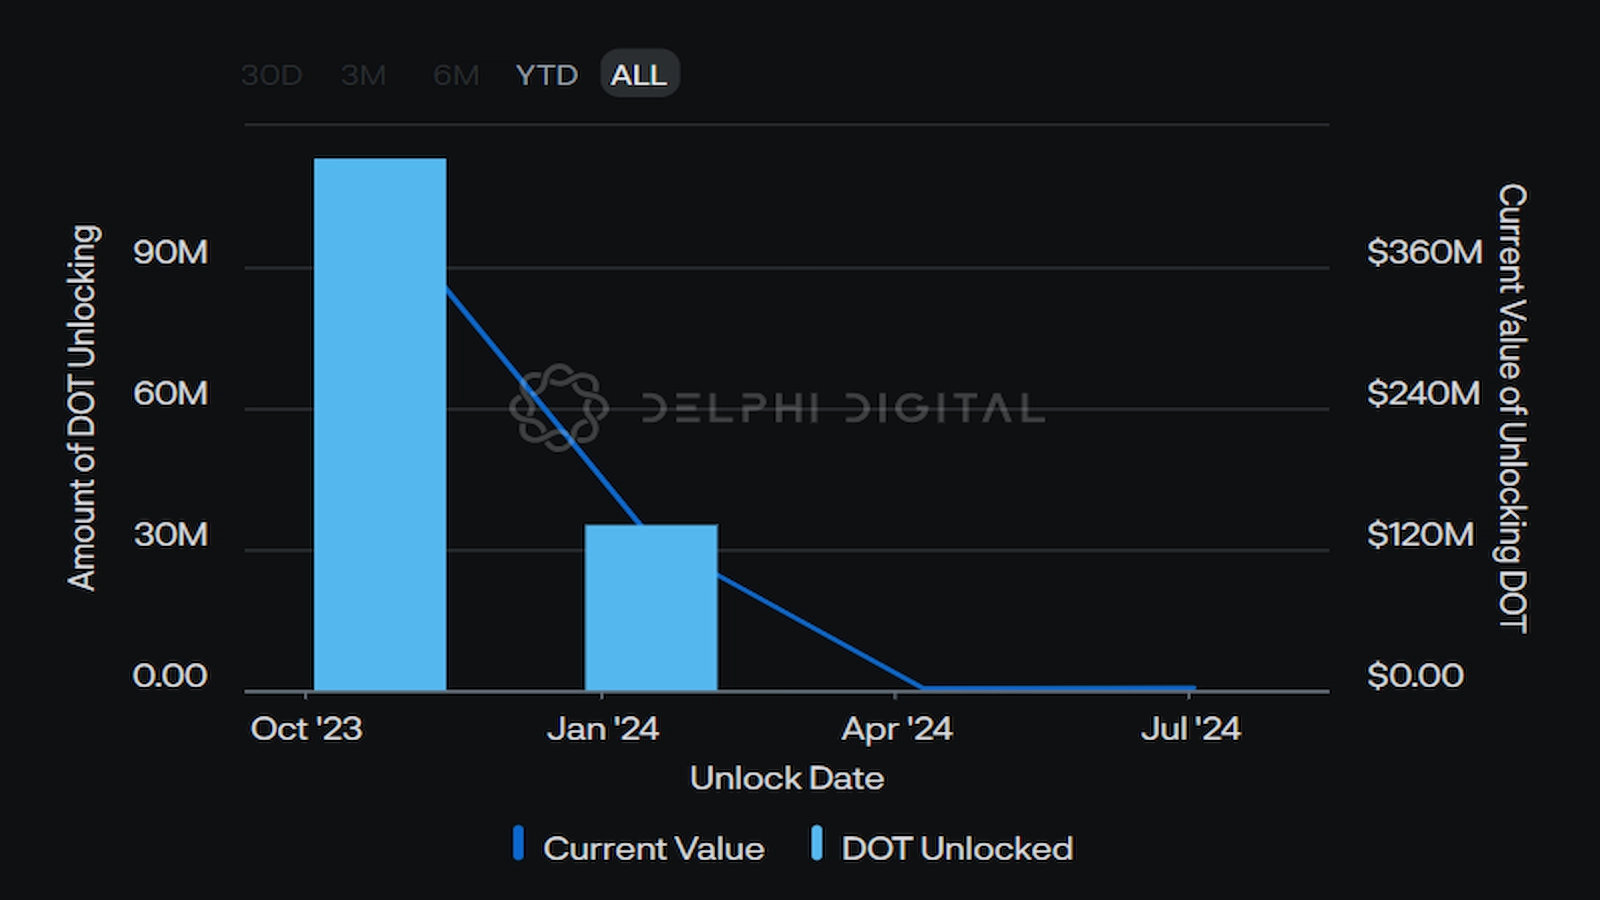
For Polkadot, the maturing of the initial parachain crowd loan would release 113 million DOT tokens on Oct. 24. However, it is only the first wave, with nearly 35.7 million DOT tokens unlocking in Jan. 2024.
Parachain crowd loans allowed projects with little capital to compete with projects with access to greater capital. In return, the projects that win the parachain slot award the community as compensation for “bonding their [community’s] tokens for the lease duration.“
Additionally, AStar, a prominent Polkadot parachain project, is migrating to Polygon to launch the AStak xkEVM L2.
To negate the bearish impact of the token unlocks, Polkadot’s governance proposed changing the formula that determines the staking rate on the project. The proposal plans to raise the interest rates to “prepare the system for these imminent unlocking events.”
If accepted, the proposal would raise the ideal staking rate from the current 52.5% to 60%.
DOT Price Continues Its Rally
Meanwhile, DOT continued its price rally in the run-up to the token unlock, spiking over 7% to reach a daily high near $4.21 on Oct. 23. The uptrend brought DOT gains to 18.3% since Oct. 19’s low of $3.56.
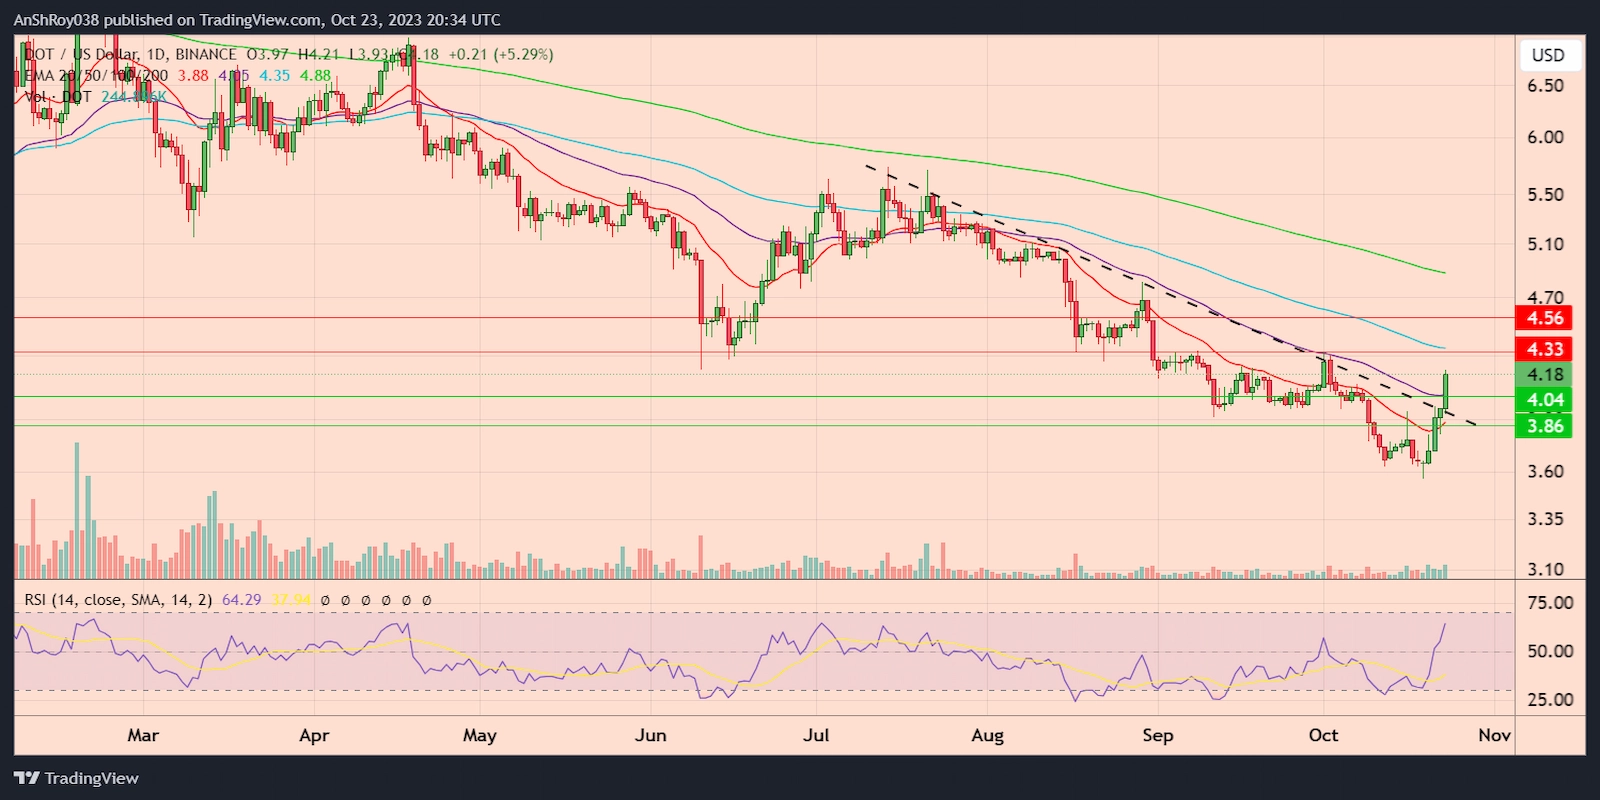
Bulls would have to break above the 100-day EMA (the blue wave) resistance near $4.33 before targeting the resistance near $4.56.
However, if bears start booking profits or the token unlock increases the selling pressure, DOT bulls would be forced to defend the 50-day EMA (the purple wave) support near $4. Breaking below the trendline might result in DOT price testing the 20-day EMA (the red wave) support near $3.86 before recovering.
The RSI for DOT remained neutral, with a score of 64.29 on the daily charts.
dYdX Hopes V4 Might Mitigate Unlock Bearish Risks
On the other hand, the decentralized exchange dYdX has a token unlock lined up that would spike its token DYDX’s circulating supply by 75% since July 2023.
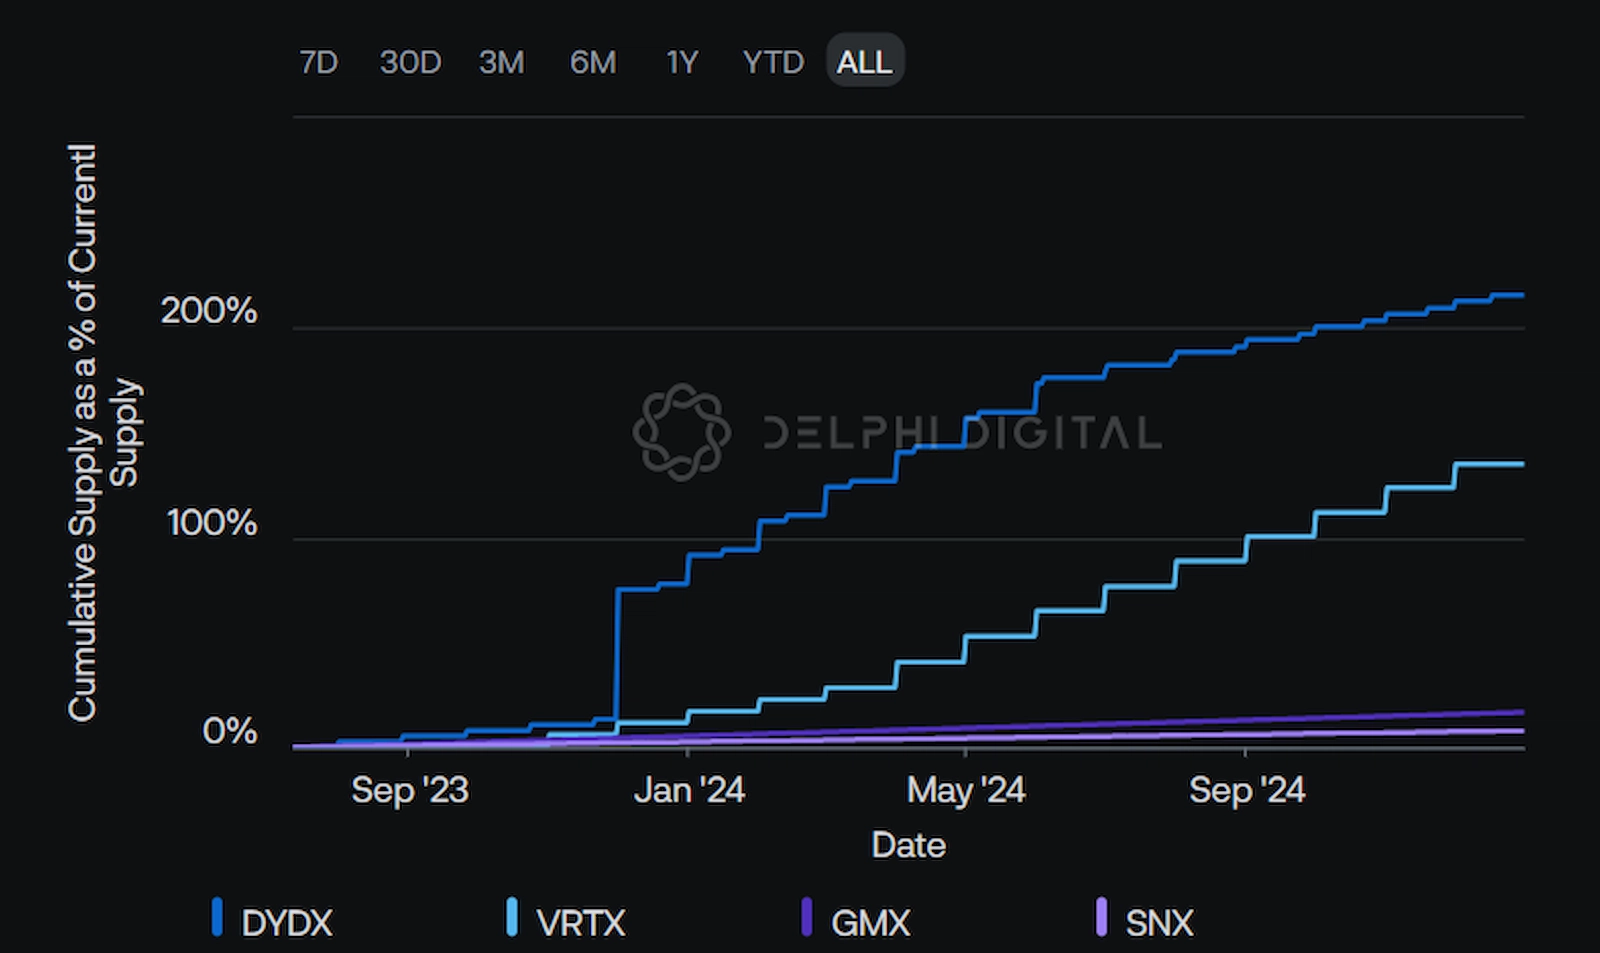
The exchange rescheduled its token unlock from Jan. 2023 to Dec. 1, 2023. The upcoming event would unlock 150 million DYDX tokens or 15% of the token’s maximum supply. As such, the unlock event would increase DYDX’s circulating supply to over 333 million tokens.
Per a Delphi Digital report, implementing the DEX’s v4 upgrade might mitigate the impact of the token unlock. The update allows holders to stake their tokens with validators to earn rewards.
However, the crypto analysis firm noted that a smooth migration to v4, the fee reward structure, and the adoption of dYdX v4 would determine the effectiveness of the approach.
DYDX Price Moving Inside Bearish Pattern
Another bearish cue for DYDX price comes from a technical pattern called the ‘Descending Triangle.’
A descending trendline connecting swing highs and a horizontal trendline joining swing lows form the pattern. The height of the triangle’s thickest section determines the price target in a descending triangle setup.
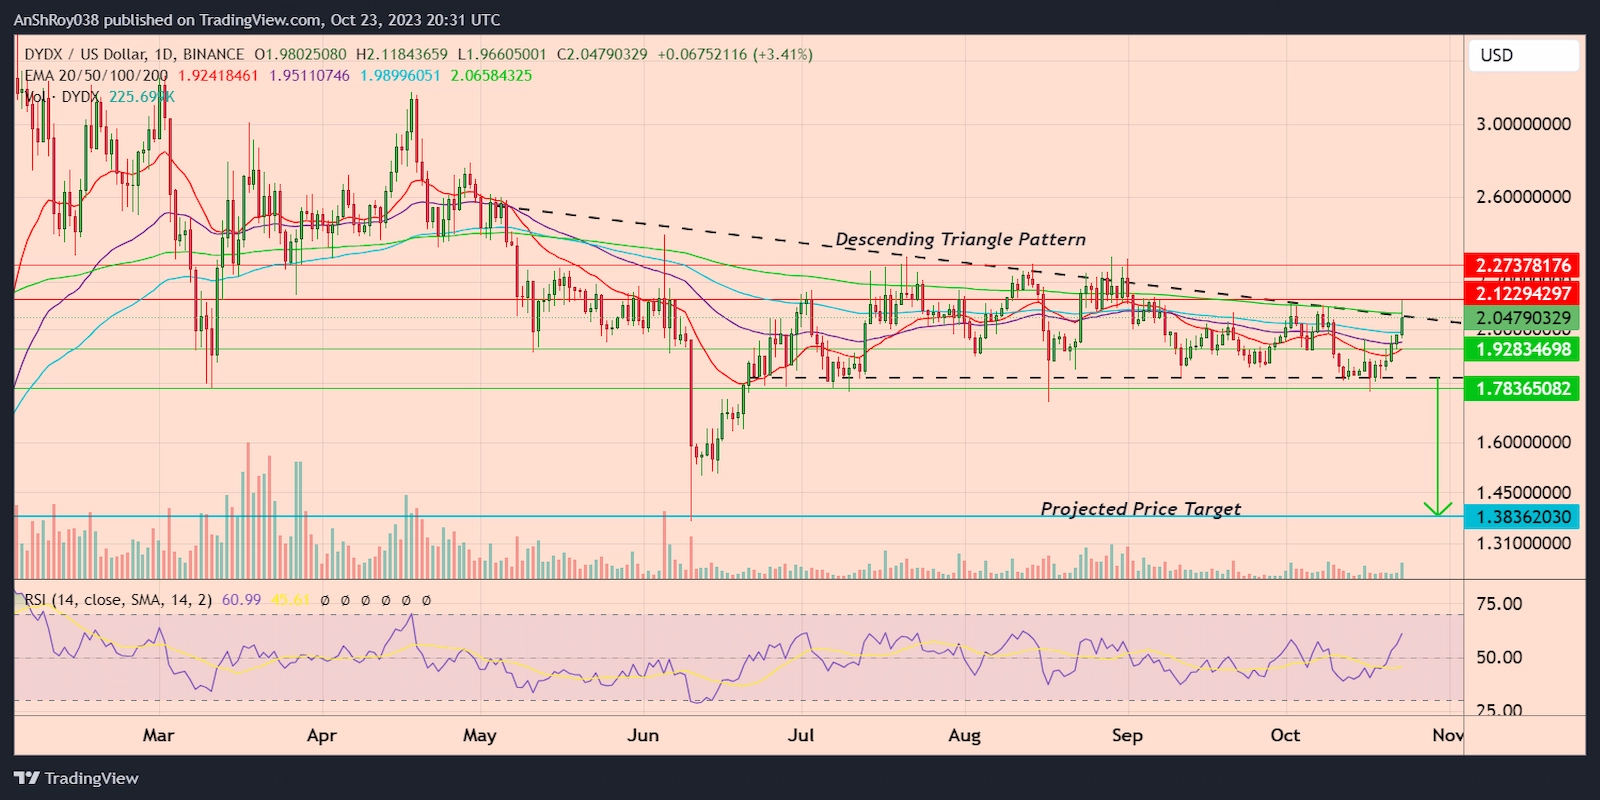
The pattern gives DYDX prices a theoretical breakdown target nearly 32% below its current price levels to reach nearly $1.38.
Meanwhile, DYDX price continued its rally, which helped the token gain nearly 20% from Oct. 17 to reach a daily high of $2.12 on Oct. 23. However, bears defended the descending trendline of the pattern, forcing the token to pare gains.
If DYDX price breaks above the trendline, bulls will need to conquer the immediate resistance near $2.1 before targeting the resistance near $2.27.
Conversely, if the selling continues, DYDX price might drop to the 20-day EMA (the red wave) near $1.93. Moreover, breaching the immediate support might force the token to confirm the bearish triangle pattern, prompting bulls to defend the support near $1.78.
The RSI for DYDX remained neutral, scoring 60.99 on the daily charts.
