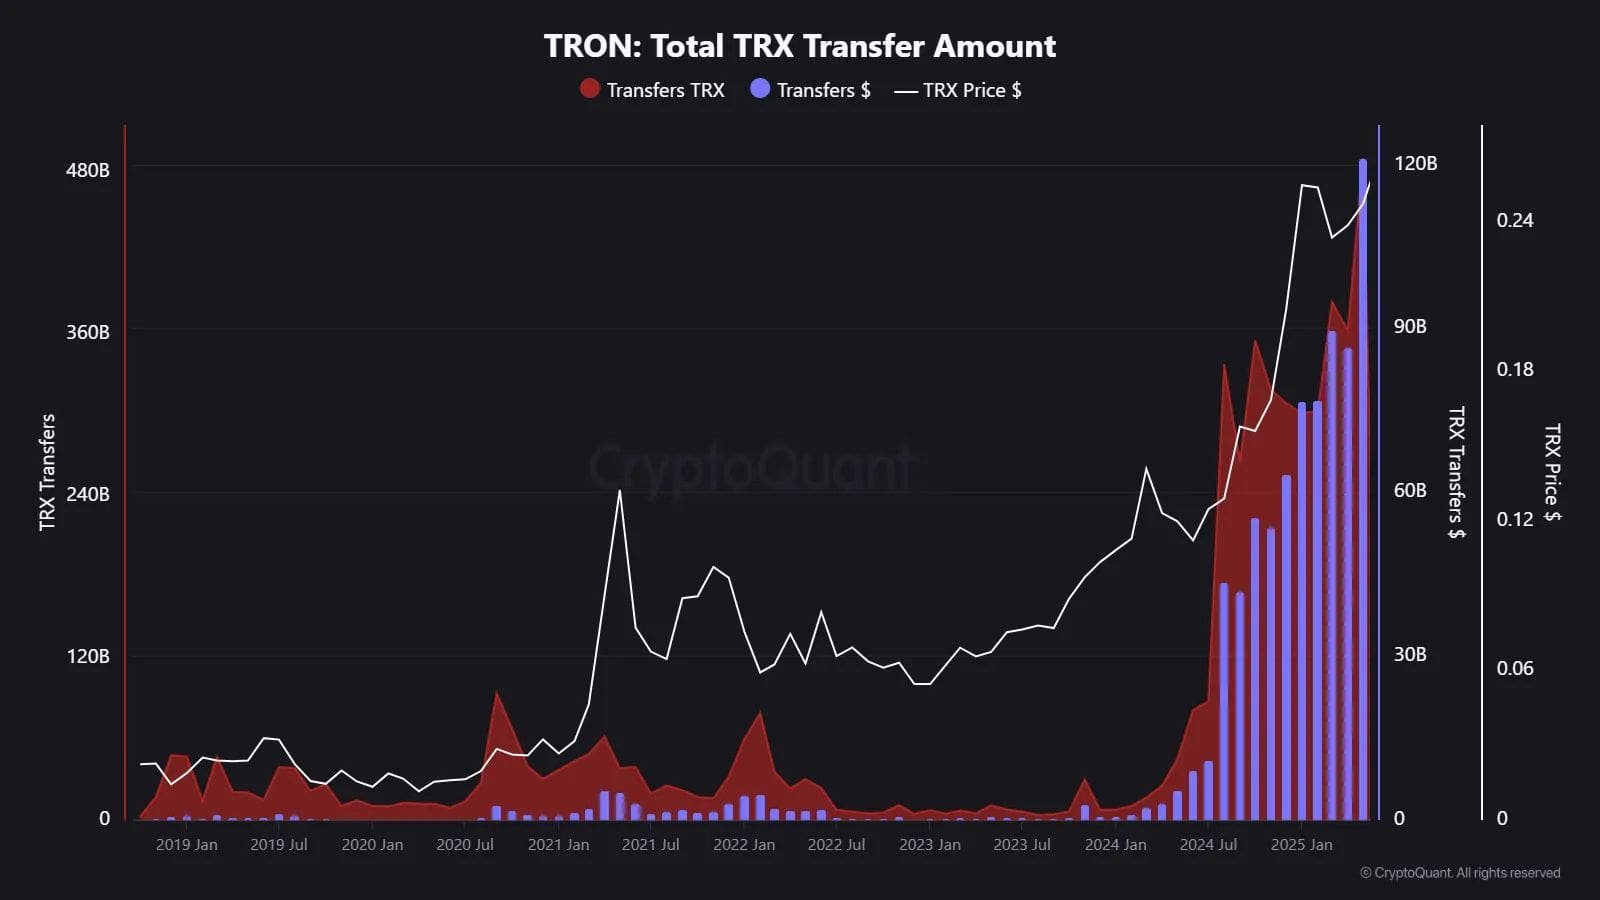
TRON’s (TRX) monthly transfer volume hit a new record in May 2025, according to on-chain data from CryptoQuant. The network processed 490.3 billion TRX in total transfers, the highest amount ever recorded in a single month.
TRON: Total TRX Transfer Amount. Source: CryptoQuant
At an average price of $0.247 per TRX, the dollar value of May’s transfers reached approximately $121.2 billion.
- Advertisement -
In April 2025, TRON users moved 362.92 billion TRX. May’s total marked a 34% increase month-over-month. The spike in volume suggests growing utility for TRON in global payments and stablecoin activity.
The year-over-year growth was even more striking. In May 2024, only 45 billion TRX were transferred. Compared to that, May 2025 saw an increase of around 990%.
Tether (USDT) remains the most transacted asset on the TRON network. Since mid-2022, TRON has consistently outpaced Ethereum (ETH) in daily USDT transfer volume. This trend confirms TRON’s position as the most used blockchain for stablecoin payments worldwide.
- Advertisement -
Tron Overtakes Cardano as Global Stablecoin Leader
A recent report by Artemis confirmed that Tron leads stablecoin transaction volumes across key regions, including Latin America, Africa, North America, Europe, and Asia.
According to the report,
“The most popular blockchains employed to settle customer flows, as a share of value sent, were Tron, followed by Ethereum, Polygon (Ethereum L2), and Binance Smart Chain.”
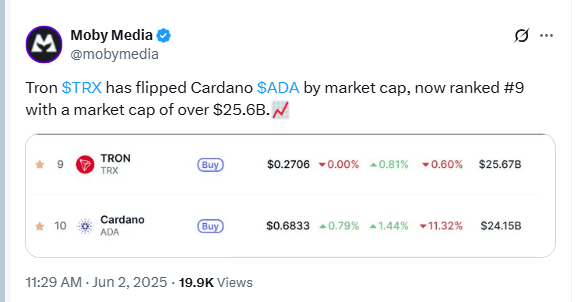
Tron Flips Cardano in Market Cap. Source: Moby Media
Alongside rising transaction volumes, Tron also gained ground in market rankings. It has now surpassed Cardano to become the ninth-largest cryptocurrency. As of the latest data, Tron’s market capitalization reached $25.6 billion, slightly ahead of Cardano’s $24.1 billion.
TRX/USDT 4-Hour Chart. Source: TradingView.com
On June 2, 2025, the 4-hour TRON (TRX/USDT) chart on Binance formed a bearish rising wedge pattern.
A bearish rising wedge appears when price moves between two converging upward-sloping trendlines. It often signals weakening momentum and a potential downside reversal. In this chart, the structure developed after a strong rally, followed by narrowing upward moves.
TRX is now trading at $0.2683. If this pattern confirms with a clean breakdown below the lower trendline, the price could drop approximately 12%, targeting the $0.2356 level. The projected target is marked on the chart with a downward arrow.
The price has already broken below the 50-period Exponential Moving Average (EMA), which currently sits at $0.2710. This breakdown adds further pressure. Volume shows no major spike yet, but continuation could accelerate if sellers gain control.
In short, if the bearish wedge confirms, TRX risks a move toward $0.2356 in the short term.
TRON RSI Dips Below Midline, Bearish Pressure Builds
As of June 2, 2025, the 4-hour RSI for TRON (TRX) sits at 43.19, with its moving average at 44.24. This places the RSI below the neutral 50 mark, signaling growing bearish momentum.
TRON (TRX) 4-Hour RSI and Moving Average. Source: TradingView.com
The RSI has trended sideways throughout May but consistently failed to reclaim strong bullish territory above 60. Each rally attempt faced resistance, while the most recent rejection near 50 reinforces the current weakness.
Since the RSI remains in the lower half of the channel and stays under its moving average, TRX may continue facing downward pressure unless bulls regain strength. If the RSI drops closer to 30, it could indicate oversold conditions.
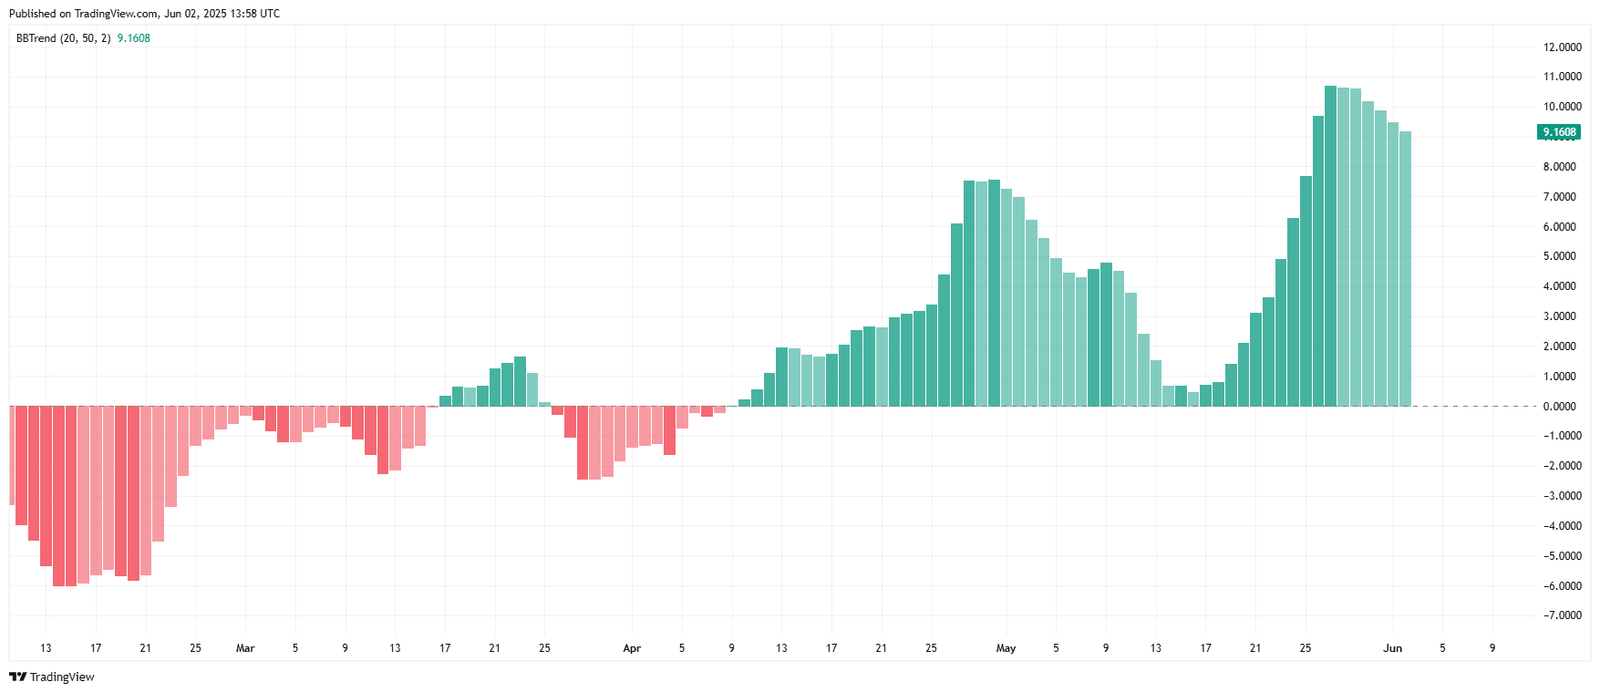
TRON BBTrend Signals Strong Bullish Momentum
As of June 2, 2025, the BBTrend indicator for TRON (TRX/USDT) reads 9.16, showing strong bullish momentum. The indicator has stayed above the zero line since mid-May and has continued climbing, reflecting sustained upward pressure.
TRON BBTrend Bullish Momentum. Source: TradingView.com
The recent uptrend began around May 23. The BBTrend bars grew sharply, peaking near 11 before slightly pulling back. Despite this minor drop, the bars remain tall and green, confirming that bulls are still in control.
Before this rally, the indicator had dipped below zero in early May but reversed direction quickly. The current structure suggests a healthy uptrend. However, if the bars shrink further or flip red, that would be an early sign of weakening momentum.
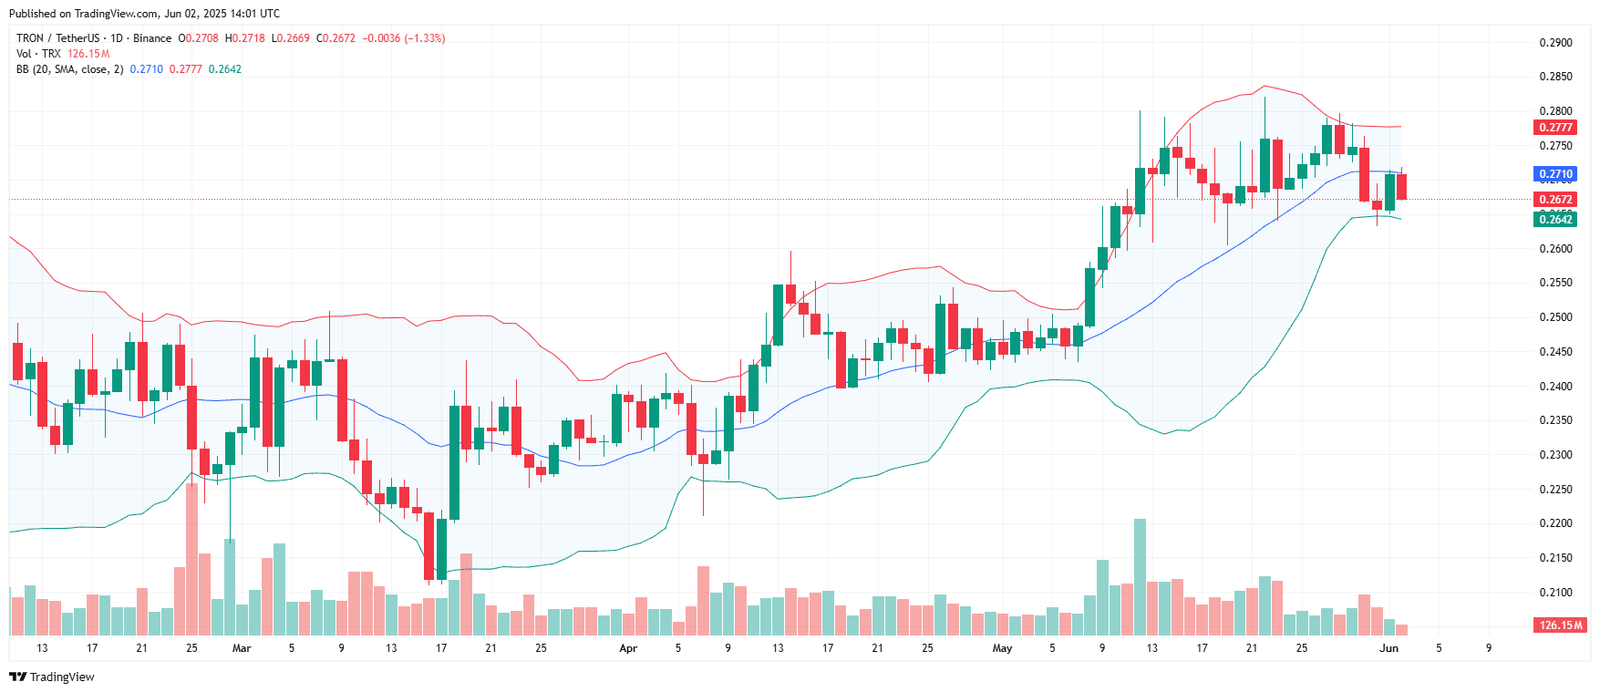
TRON Price Slips Below Mid-Band as Bearish Momentum Builds
As of June 2, 2025, TRON (TRX/USDT) trades at $0.2672, dipping below the 20-day simple moving average (SMA) midline of the Bollinger Bands, which sits at $0.2710.
TRON Breaks Below Bollinger Mid-Band. Source: TradingView.com
The recent daily candles show clear rejection at the upper band near $0.2777, followed by increased selling pressure. Price now hovers close to the lower band at $0.2642, suggesting downside continuation may follow if buyers fail to reclaim the midline.
Trading volume reached 126.15 million, reinforcing the bearish shift. The Bollinger Bands have started to narrow, signaling lower volatility. However, price moving outside or sticking to the lower band could trigger further decline.
If TRX closes below the lower band, the next support may appear near $0.2600, which served as a consolidation area earlier in May.
Tatev Avetisyan is a Markets Writer and Analyst at CoinChapter, covering cryptocurrency markets, policy, and regulation. With over seven years of experience in business and marketing development, she has spent the past two years specializing in digital assets and has authored more than 2,000 articles on crypto markets and regulatory developments.She contributes as a guest writer to leading industry publications and is a prominent Web3 advocate in Armenia through Web3Armenia. Her work reflects a broader focus on artificial intelligence and Web3 technologies.
Tatev maintains a diversified crypto portfolio, with Bitcoin as her primary holding above CoinChapter’s $1,000 disclosure threshold.