
Key Takeaways:
- Trust Wallet token formed a “double bottom” bullish setup.
- Technicals could take the coin 15% higher in the coming weeks.
- The daily chart drew a setup with a higher target.

YEREVAN (CoinChapter.com) — Trust Wallet token (TWT) rose 10% to $0.90 on Oct 5, bringing its overall weekly gain to 25%. However, the TWT bulls are not through, as the coin eyes another 15% rise in the coming weeks due to a technical setup.
TWT formed a “double bottom.”
Trust Wallet token formed a “double bottom” pattern, best visible on the weekly chart. The setup entails two consecutive drops to the same support level with an intermediate uptick, resembling the letter “W.”
Meanwhile, the double bottom typically follows a downfall but signals a reversal and the beginning of a potential uptrend. Moreover, the leg up could equal the initial decline level, pinning the target for TWT at approximately $1 in the weeks ahead.
TWT initially dropped to the key $0.74 support in early June, partially recovering, and dropping again in early September, retesting the mentioned line.
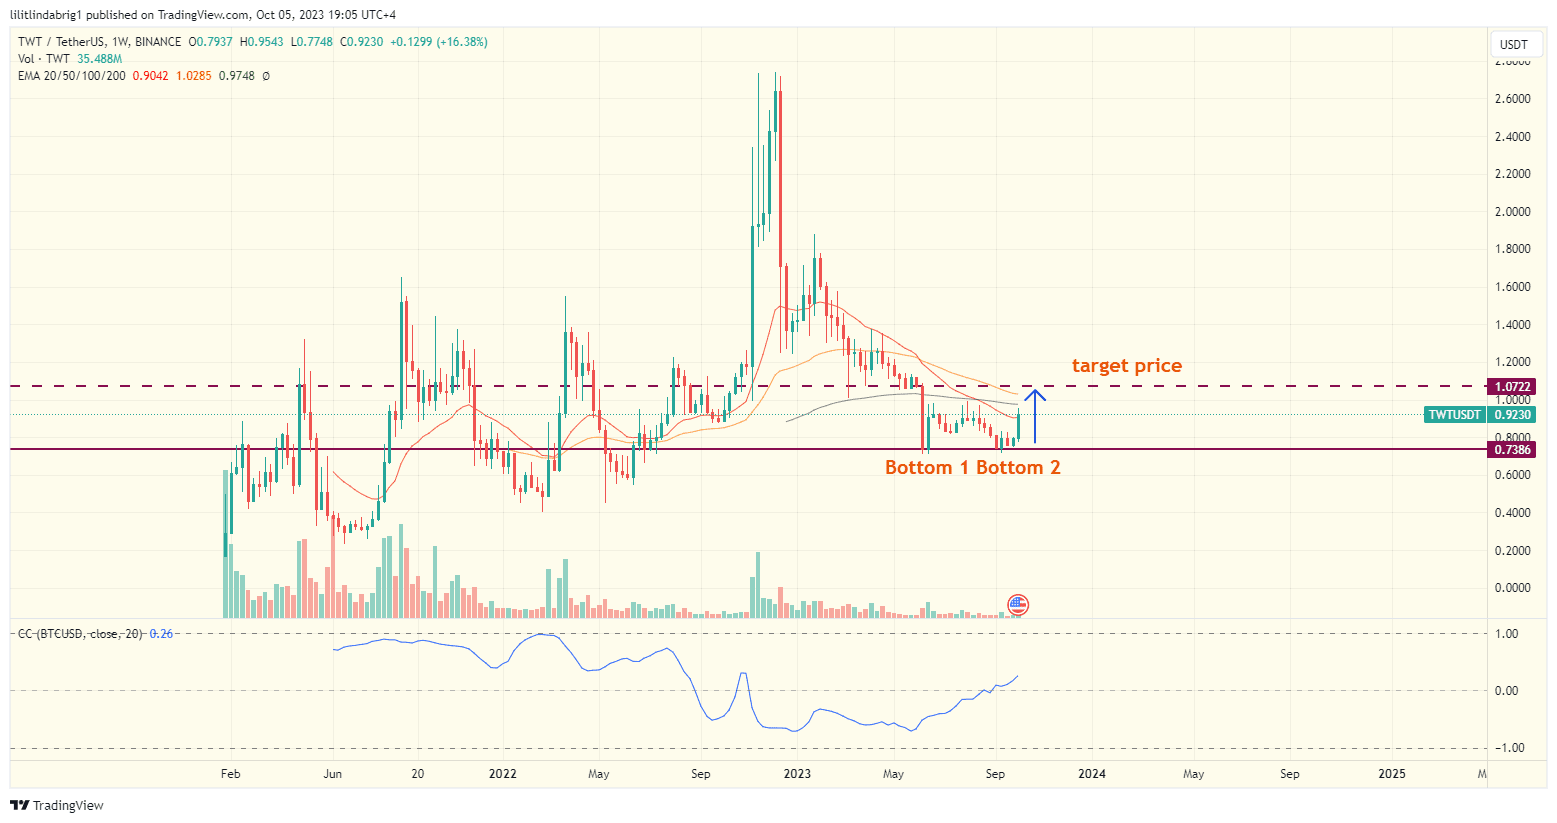
Importantly, a spike in volume typically occurs during the two upward price movements in the pattern. These spikes in volume strongly indicate upward price pressure and further confirm the “double bottom” pattern. TWT trading volumes soared over 300% in the previous 24 hours, confirming the bullish stance.
The daily chart confirms the target.
The token’s daily chart also painted a bullish setup dubbed the “falling wedge.” The latter features two converging, down-sloping trendlines. However, the falling wedge is also a bullish reversal pattern.
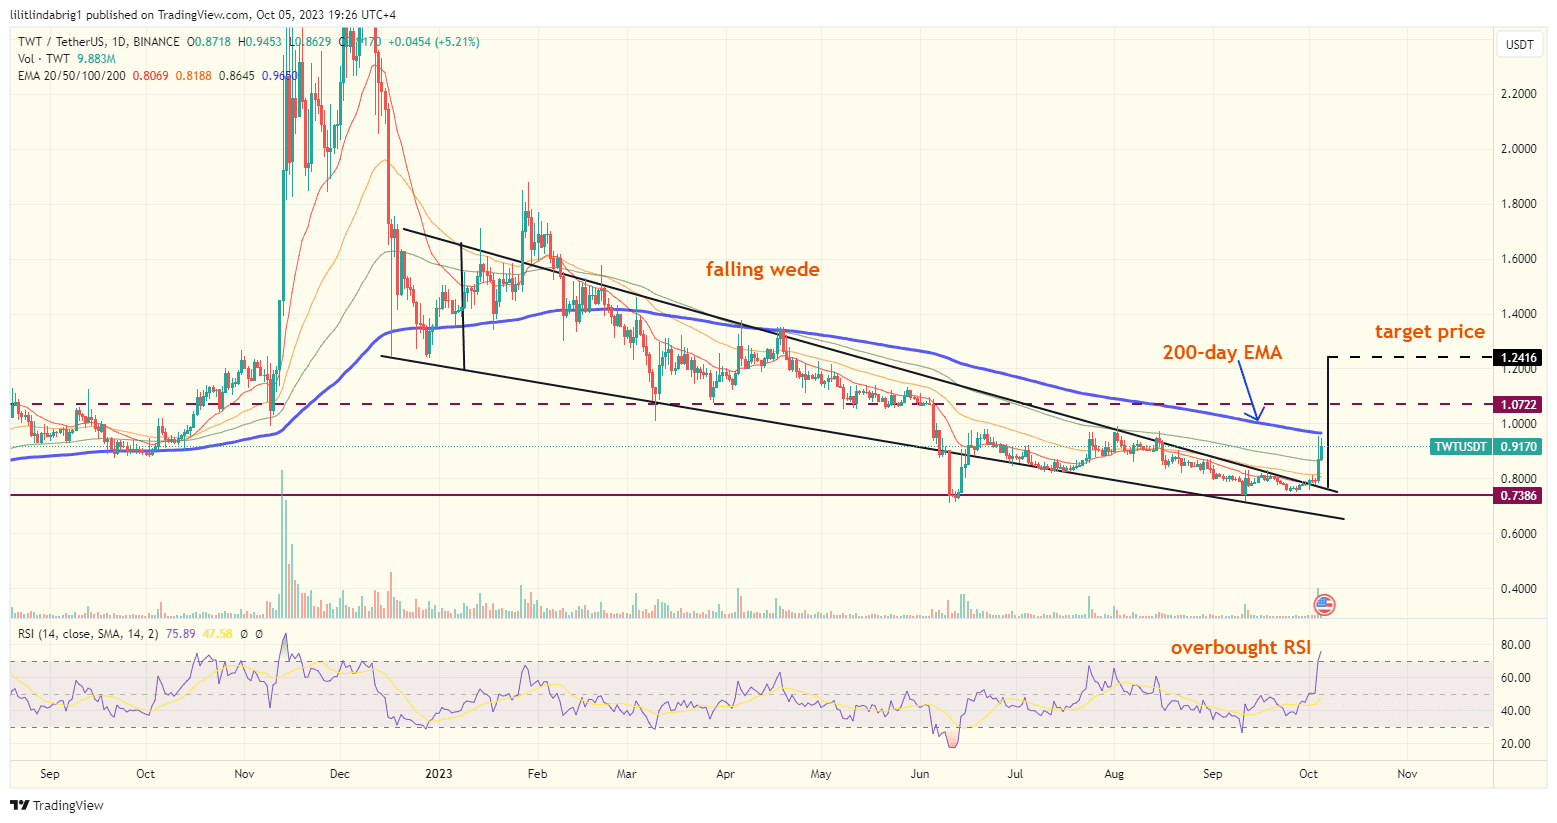
TWT confirmed it by breaching the resistance line on Oct 1. Thus, the target price for the coin would stand at a distance equal to the formation height, at $1.2, a possible 35% rally.
The strong trading volumes could also be enough for TWT to conquer its 200-day exponential moving average (200-day EMA; blue wave), which hindered the token’s bullish moves since March 2023.

… [Trackback]
[…] Information on that Topic: coinchapter.com/trust-wallet-token-twt-eyes-a-15-rally-credits-to-double-bottom-setup/ […]
… [Trackback]
[…] Info on that Topic: coinchapter.com/trust-wallet-token-twt-eyes-a-15-rally-credits-to-double-bottom-setup/ […]
… [Trackback]
[…] Find More Info here on that Topic: coinchapter.com/trust-wallet-token-twt-eyes-a-15-rally-credits-to-double-bottom-setup/ […]