

MANALI (CoinChapter.com) — Waves price rallied 77% in just seven days of trading, reaching as high as $53.74 on Mar. 31 after bottoming out near $30.30.
The recent uptrend is part of WAVES price massive March rally that saw it break into the list of top 50 cryptocurrencies by market capitalization. Notably, it jumped nearly 272% between March’s low ($16.12) to high (near $60) levels.
The Waves price charted a new ATH of $59.9 (Binance) on Mar 30. Although long upper wicks on the daily candles highlight aggressive selling by bears, bulls have held their own as the token looks to chart new record highs.
Also Read: Waves Finance (WAVES) explodes 117% in a week.Adding bullish cues to the token’s rally, WAVES price 50-day Moving Average (yellow wave) moved above its 200-day MA (green wave) to form a bullish technical pattern called a golden cross. The pattern forms when a short-term MA line crosses above a relatively long-term one.
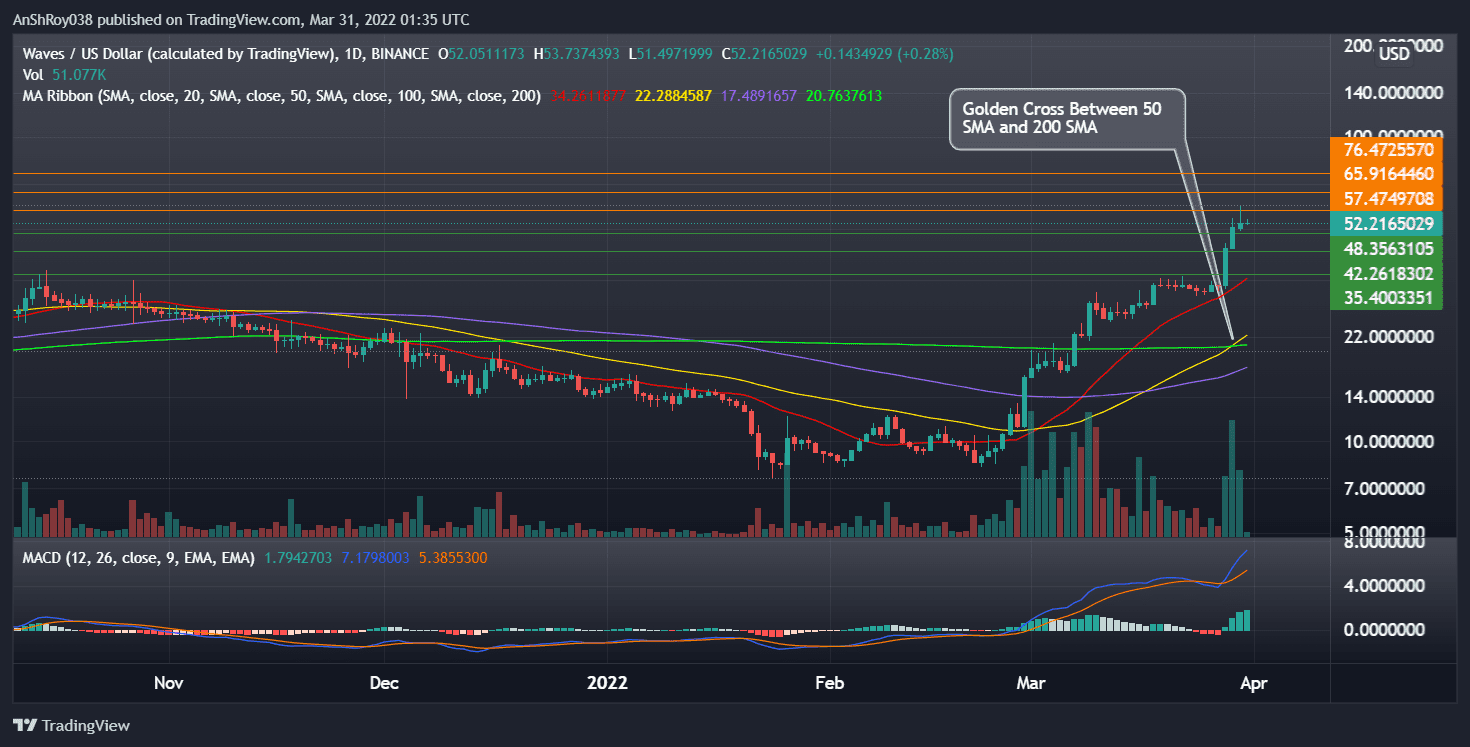
Bulls could take cues from the golden cross to continue pushing the trend upward.
Furthermore, momentum oscillator MACD continues to be bullish for the Waves token, after charting a bullish crossover on Mar 28. A bullish crossover forms when the MACD line (difference of 12-day and 26-day EMA) moves above the MACD signal line (9-day EMA of MACD).
In addition, bars on the MACD histogram are expanding, indicating a strengthening bullish momentum for WAVES.
As such, the Waves token could ride bullish tailwinds to flip immediate resistance near $57 before targeting resistance near $66. A sustained uptrend might see WAVES reach $76 before retreating.
WAVES Price Ignores Overbought RSI
An interesting aspect of WAVES price ongoing rally is the token’s relative strength index. WAVES’ RSI moved into overbought regions on Feb 28 and has since remained in the dreaded overbought region.
Traders often consider an overbought RSI a prelude to an upcoming trend reversal in bears’ favor. As such, overbought RSI levels often trigger sell-offs. However, Waves has maintained its bull run despite an overbought RSI.
Also Read: WTF! Umbrella Network (UMB) jumped more than 17,000% in a day, or did it?Currently, RSI for Waves is at 90.38 on the daily charts.
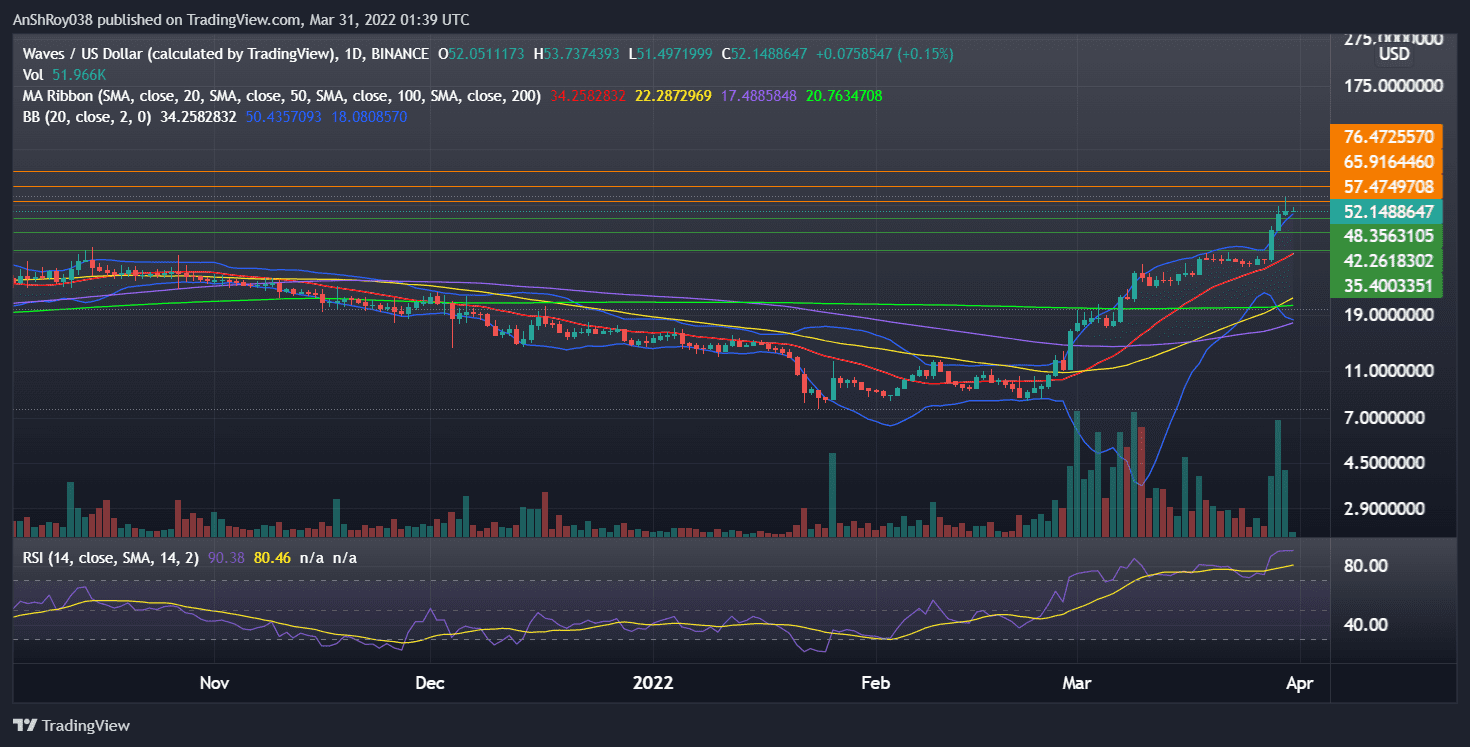
Moreover, the digital asset’s prices moved above the upper band of the Bollinger bands indicator on Mar 29.
In detail, Bollinger bands consist of a simple moving average (middle band) and an upper and lower band. The two bands are usually two standard deviations from the middle band. When an asset’s prices break above the upper bands, it denotes an overbought condition.
Traders relying on either of the two indicators would likely start selling, which would bring WAVES prices down to immediate support at $48.4. If the immediate support fails, the Waves token could fall to support at $42.3, near the token’s previous ATH.
Finally, WAVES 20-day MA (red wave) provides support for the token near $35.
At the time of writing, WAVES was trading at $50.5, down 3% on the day.

… [Trackback]
[…] Find More on that Topic: coinchapter.com/waves-price-jumped-77-in-seven-days-whats-next/ […]
… [Trackback]
[…] Find More here on that Topic: coinchapter.com/waves-price-jumped-77-in-seven-days-whats-next/ […]
… [Trackback]
[…] Read More on that Topic: coinchapter.com/waves-price-jumped-77-in-seven-days-whats-next/ […]
… [Trackback]
[…] There you can find 26270 more Info to that Topic: coinchapter.com/waves-price-jumped-77-in-seven-days-whats-next/ […]
… [Trackback]
[…] Information to that Topic: coinchapter.com/waves-price-jumped-77-in-seven-days-whats-next/ […]
… [Trackback]
[…] Info on that Topic: coinchapter.com/waves-price-jumped-77-in-seven-days-whats-next/ […]
… [Trackback]
[…] Info to that Topic: coinchapter.com/waves-price-jumped-77-in-seven-days-whats-next/ […]