
Pi Network’s code remains closed-source, and this is the first major reason analysts say Binance has not listed the Pi Coin (PI). According to Kim H. Wong, a crypto analyst, top exchanges prefer transparency. Open-source code allows developers and auditors to examine the network’s security and performance.
Wong stated in a post on X that “open-source code facilitates trust and technical scrutiny.” Binance and Coinbase use this transparency to assess the project’s stability before listing. However, Pi Network’s blockchain has not yet allowed that public inspection.

This closed structure limits the ability to run independent audits, review smart contracts, or confirm how the system handles transactions. Without access to the source code, exchanges and external developers are unable to confirm whether Pi meets basic technical standards or security thresholds.
No Third-Party Security Audit Found for Pi Coin
The second barrier Wong identified is the absence of a third-party security audit. Major crypto exchanges require full audits before listing tokens. These audits are usually carried out by firms like CertiK or Hacken, which check for flaws in the system’s security.
Wong explained that Coinbase emphasizes rigorous security reviews, while Binance focuses on technical stability and how well a project can handle demand. However, Pi Network has no available documentation confirming any verified audits. Some audit claims have even been contradicted by official disclaimers from the project itself.
According to Wong, this lack of transparency puts Pi at a disadvantage. Although open-source code is not mandatory, having a public audit helps meet exchange requirements. Binance and Coinbase want to reduce risks for their users, and unaudited platforms may not meet their compliance standards.
So far, there is no record of Pi Network publishing or referencing any formal audit from a recognized security firm. Without this documentation, listing on leading exchanges remains unlikely.
No Public Record of Binance or Coinbase Listing Request
The third issue Wong noted is the absence of an official listing application. Binance and Coinbase require project teams to submit detailed applications. These include technical papers, compliance documents, and background checks.
Even though Pi Coin is already trading on platforms like OKX, MEXC, and Bitget, Wong questioned whether Pi Network has ever engaged with Binance or Coinbase directly. Exchanges do not list coins automatically. Projects must actively approach them and meet their internal listing criteria.
Wong emphasized that “exchanges often require proactive engagement” from the token’s core team. Without formal communication, these exchanges may not even consider Pi Coin for listing.
Pi Coin did receive support in a community vote on Binance, with 86% voting in favor of a listing. However, Binance did not act on that result. During Pi2Day, many users expected a listing announcement, but none came.
Pi Network (PI/USDT) Forms Bullish Falling Wedge Pattern on July 16
On July 16, 2025, the Pi Network to Tether (PI/USDT) 1-hour chart on OKX shows a bullish falling wedge pattern. A bullish falling wedge pattern is a downward-sloping price formation with converging trendlines, where the decline becomes weaker over time. It often signals that a price reversal to the upside may follow.
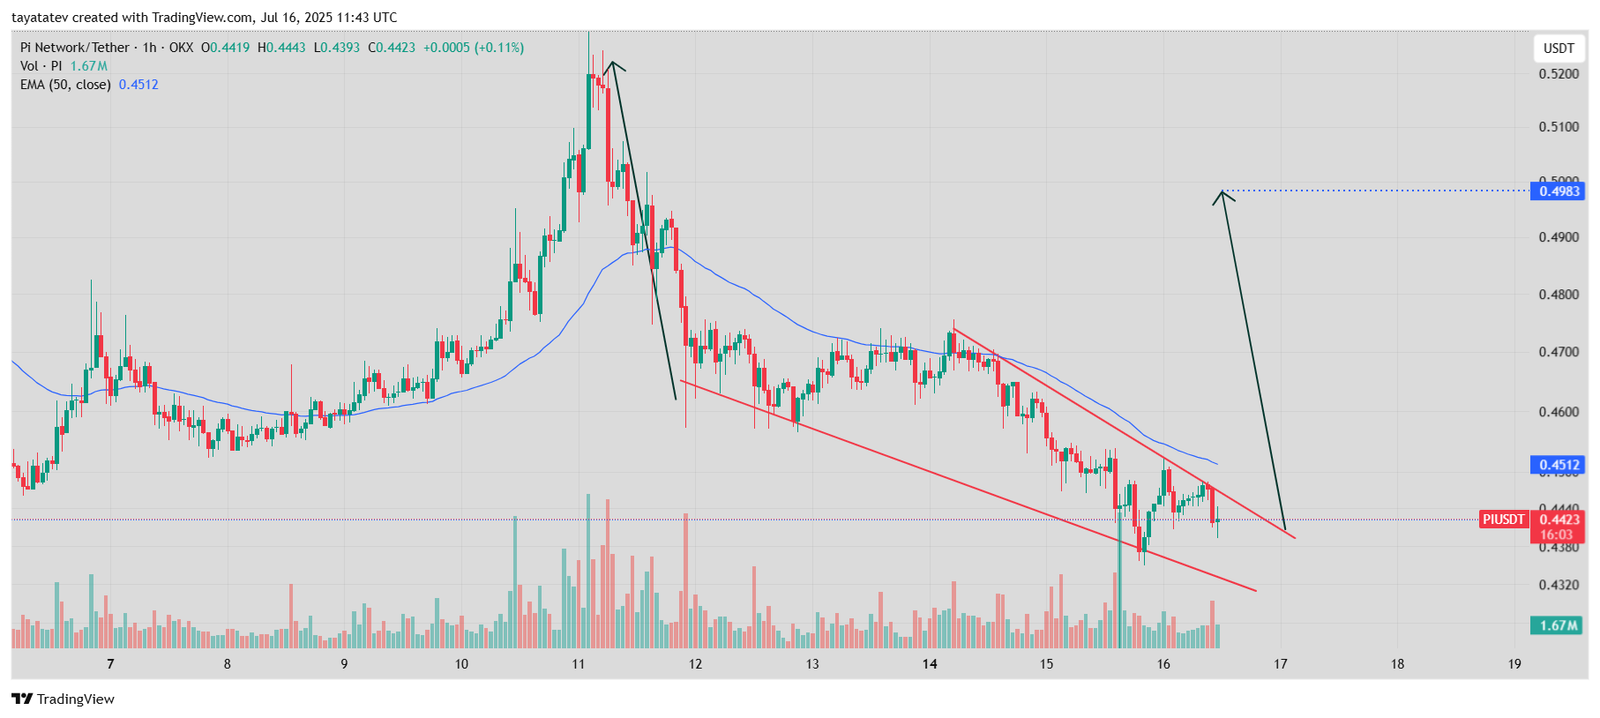
The wedge began forming after the steep drop from the July 11 high. Since then, the price has trended lower inside two red downward trendlines. The volume decreased gradually, which matches typical wedge behavior. The 50-period Exponential Moving Average (EMA) is currently at $0.4512, sitting above the current price of $0.4423, acting as nearby resistance.
If the pattern confirms a breakout, the price could jump nearly 12% from the current level of $0.4423 toward the next major resistance near $0.4983. This target aligns with the height of the wedge added to the breakout point.
Volume increased during recent candles, suggesting stronger interest. If the breakout continues, this price action may validate the pattern and attract more short-term buyers.
However, the price must close above the top red trendline to confirm the breakout. Traders also watch the EMA line at $0.4512. A strong move above both the EMA and the wedge may open the way toward the $0.4983 level.
Pi Network RSI Shows Recovery Signal Below Neutral on July 16
On July 16, 2025, the 14-period Relative Strength Index (RSI) chart for Pi Network (PI/USDT) indicates mild upward momentum. RSI is a technical indicator that measures the strength and speed of price movements on a scale from 0 to 100. Levels above 70 suggest overbought conditions, while levels below 30 suggest oversold conditions.
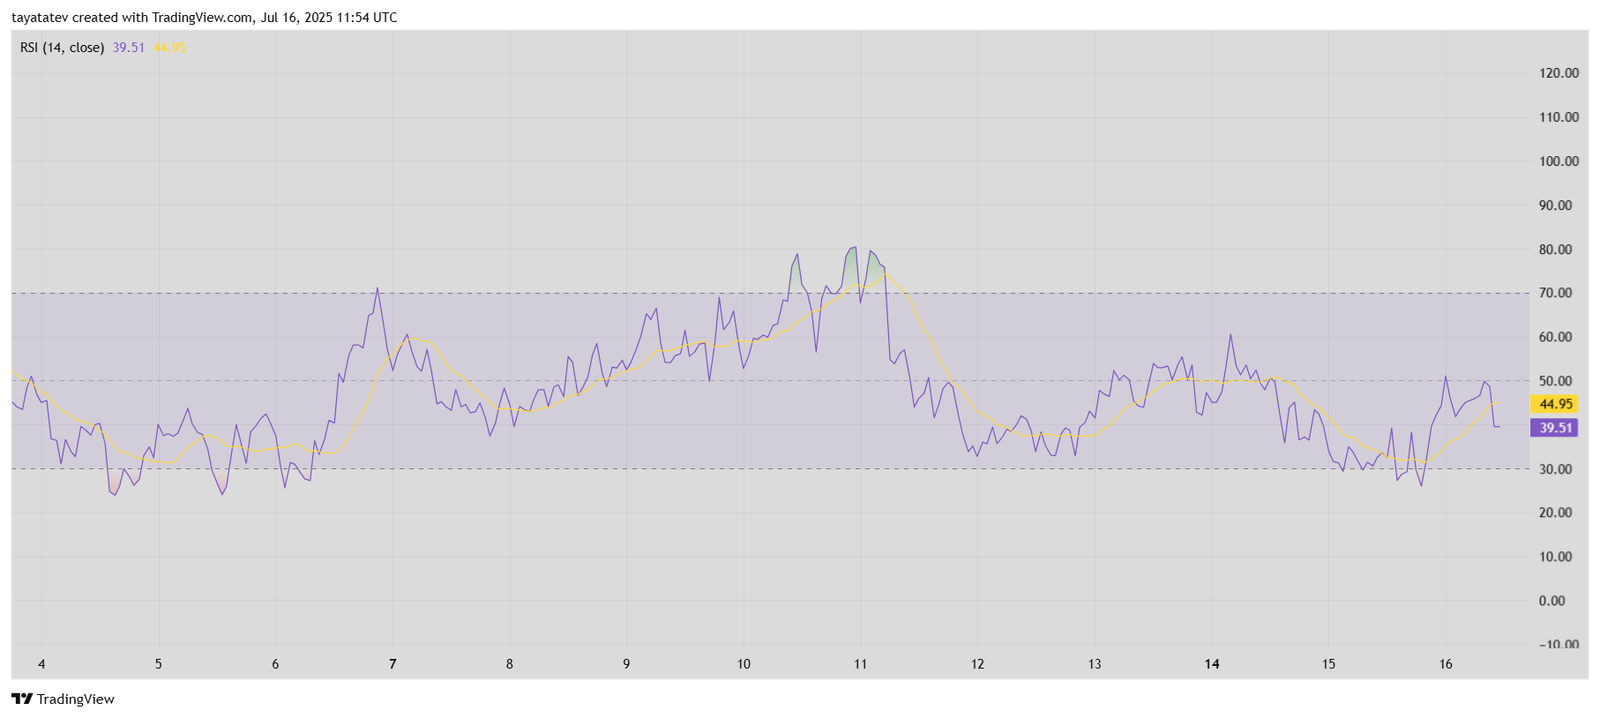
As of the latest data, the RSI is 39.51, still below the neutral level of 50. This suggests that Pi remains in a weak trend, though the direction is starting to shift. The yellow signal line, currently at 44.95, shows a slight upward slope, meaning the recent gains are beginning to build pressure from the downside.
During the earlier part of the chart, the RSI dipped below 30, indicating a short-term oversold signal. This zone triggered a mild bounce, which is now reflected in the gradual RSI rise. However, the strength of this move remains modest.
For stronger confirmation, RSI must break above 50 and hold. If this happens, it may validate the potential price breakout seen in the falling wedge chart. Until then, the market shows cautious optimism, with momentum leaning toward recovery but not yet confirmed.
MACD for Pi Network Hints at Possible Reversal on July 16
On July 16, 2025, the Moving Average Convergence Divergence (MACD) indicator for Pi Network (PI/USDT) showed early signs of upward momentum. MACD helps identify trend direction and strength by tracking the relationship between two exponential moving averages (EMAs) — a 12-period and a 26-period.
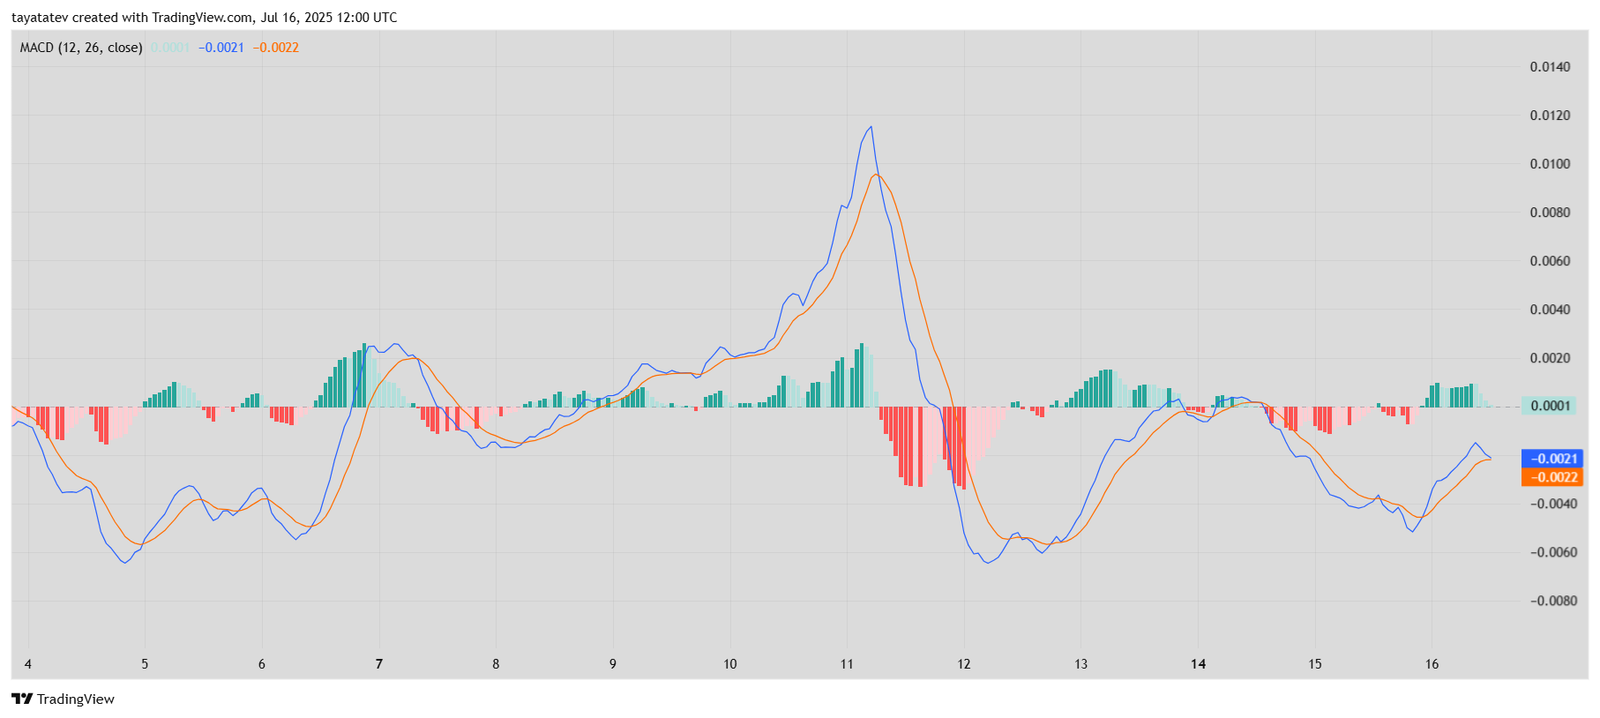
In the chart, the MACD line (blue) is currently at -0.0021, and the signal line (orange) is at -0.0022. These values are nearly aligned, suggesting a potential crossover. When the blue MACD line moves above the orange signal line, it often indicates a shift toward bullish momentum.
Also, the histogram bars just turned green, marking a small positive reading of 0.0001. This shift from red to green means that the downward pressure may be weakening. The last time a similar crossover happened on July 10, the price experienced a steep rally.
For now, the lines remain below the zero line, showing that overall momentum is still weak. However, the narrowing gap and growing histogram suggest that buyers are returning.
Balance of Power Shows Bulls Regaining Control in Pi Network on July 16
The Balance of Power (BoP) indicator for Pi Network (PI/USDT) registered a positive reading of 0.47, suggesting that buyers currently have an edge over sellers. This indicator measures the strength of buying versus selling pressure on a scale that moves between -1.0 and +1.0.
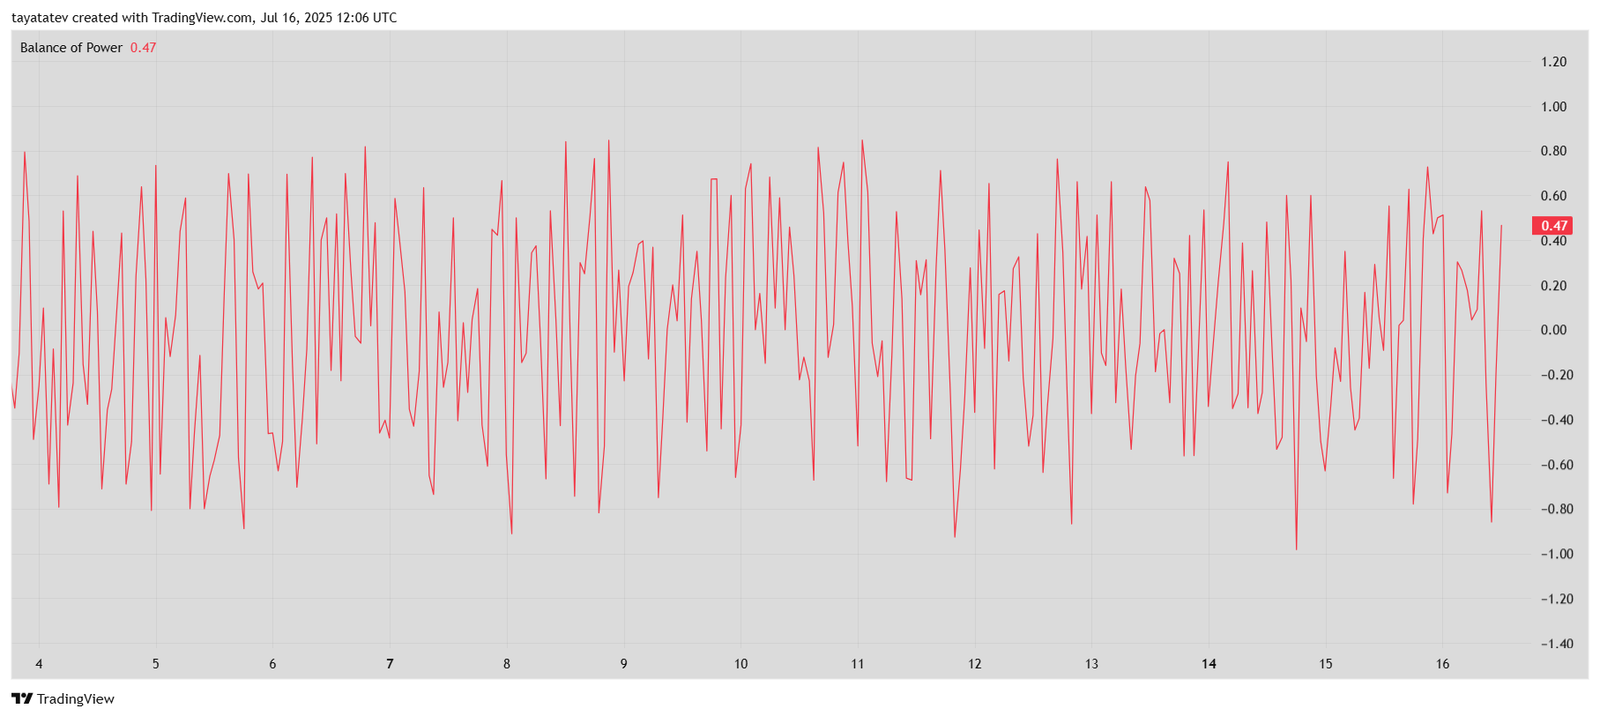
Positive BoP values above 0 show that bulls are in control, while negative values below 0 indicate bearish pressure. The current reading of 0.47 shows that buyers are pushing back after recent price drops.
Throughout the week, the BoP has fluctuated heavily, with sharp spikes both upward and downward. This reflects ongoing volatility in the market. However, the recent shift back above the 0.40 zone signals renewed short-term buying interest.
If the BoP remains positive in the next few sessions, it may confirm the bullish breakout seen in the falling wedge chart. Traders often use this indicator to validate strength after price patterns begin to form.
