

NOIDA (CoinChapter.com)— Will Pepe surge in the coming months, gearing up for a bull run? The frog-themed meme crypto asset, integral to this year’s March memecoin mania, has formed a bullish reversal pattern.
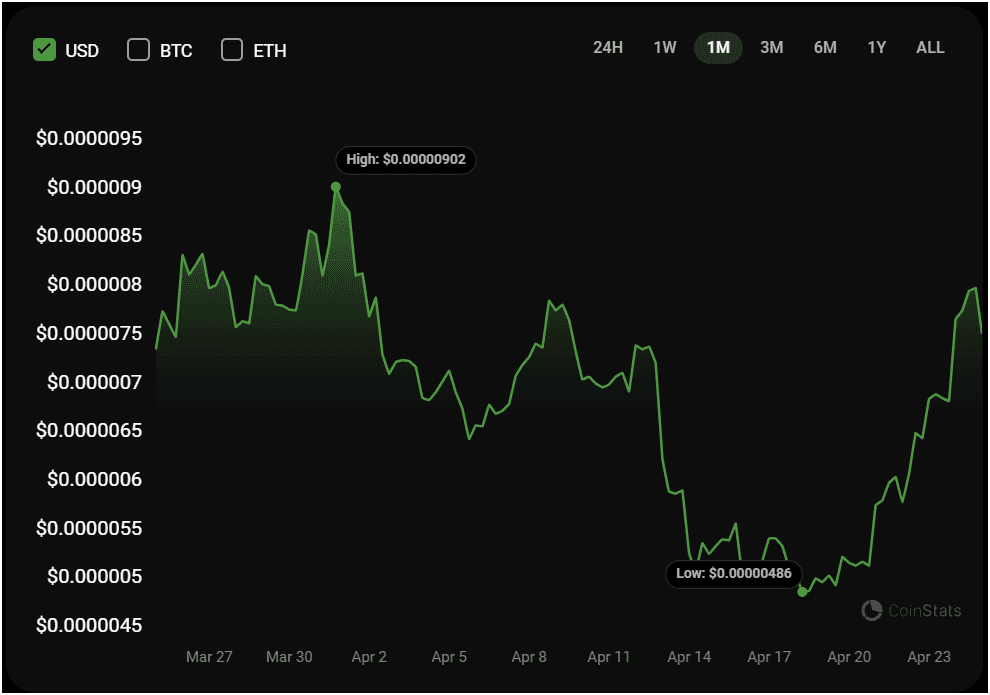
PEPE has recovered smartly following the recent April 13 crypto market flash crash. This suggests strong demand for the token. The memecoin is up by more than 470% year-to-date despite recent corrections, thanks to the memecoin frenzy in March.
PEPE Price Confirming Bullish Pattern
Notably, Pepe coin is currently in the midst of breaking out of a bullish reversal pattern called the ‘Bump and Run Reversal (BARR) Bottom pattern.’
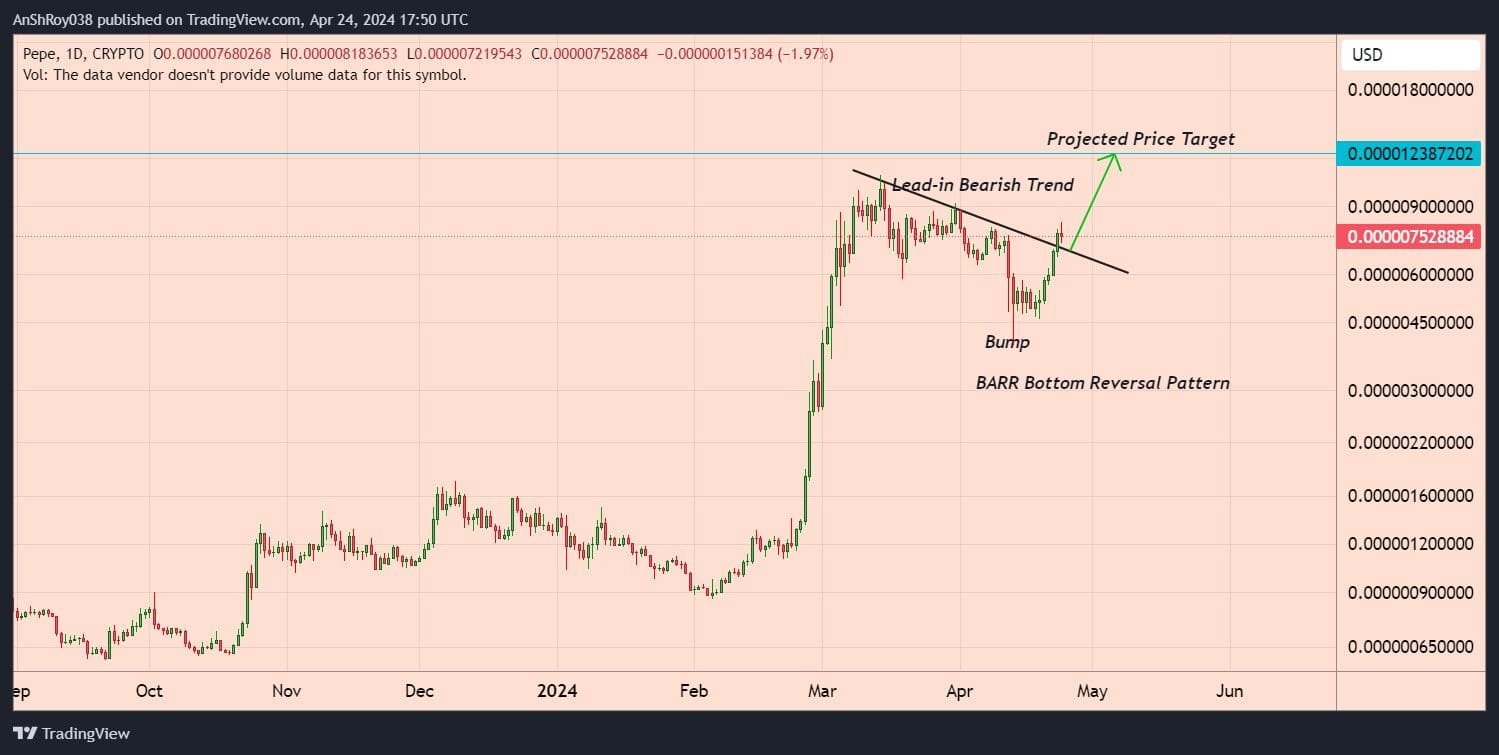
The pattern forecasts a bullish reversal after a steep downtrend in an asset’s prices. The BARR Bottom pattern unfolds through three stages: an initial lead-in phase with a gentle decline, a bump phase where prices plummet sharply, and a run phase where prices rise above the initial trend line.
Traders identify the price target for this pattern by measuring the ‘bump height,’ the vertical distance from the trend line to the bump’s lowest point.
Moreover, the pattern allows traders to anticipate shifts in market momentum. This enables strategic long-position entries. Accurate identification and volume confirmation are crucial for effectively using the BARR Bottom pattern in trading strategies.
In fact, per the rules of technical analysis, once PEPE confirms its breakout from the pattern, the memecoin could rally over 65% to reach the theoretical price target near $0.0000124.
Bearish Presence Strong In PEPE Markets
Meanwhile, PEPE price fell victim to strong bearish pressure on April 24. It dropped nearly 12% from the day’s high near $0.0000082 as bears aggressively defended the supply zone near $0.0000087.

Notably, if the PEPE coin price breaks and consolidates above the immediate resistance, the memecoin might rally to the resistance near $0.0000105.
On the other hand, if bears gain the upper hand, PEPE price could drop to the 20-day EMA (red wave) and 50-day EMA (purple wave) support confluence near $0.00000612. Moreover, failure of immediate support could send the Pepe coin price to the 0.236 FIB support near $0.0000044.
Additionally, the relative strength index, or RSI, for Pepe remained neutral, with a score of 58.47 on the daily charts.

… [Trackback]
[…] Info to that Topic: coinchapter.com/will-pepe-surge-65-by-june/ […]
… [Trackback]
[…] Read More Info here to that Topic: coinchapter.com/will-pepe-surge-65-by-june/ […]
… [Trackback]
[…] Info on that Topic: coinchapter.com/will-pepe-surge-65-by-june/ […]
… [Trackback]
[…] There you will find 23275 additional Information on that Topic: coinchapter.com/will-pepe-surge-65-by-june/ […]