
XDC Network has expanded its reach in decentralized finance with a new strategic investment in Kasu Finance. The move highlights the network’s focus on bridging traditional trade finance with modern DeFi infrastructure.
Executives explained that Kasu Finance is developing tools to connect real-world trade finance with blockchain-backed solutions. Through this investment, XDC aims to position itself as a leading protocol for trade-related digital assets while also deepening its role in the wider DeFi ecosystem.
The partnership is expected to accelerate adoption of blockchain technology in markets where access to trade financing has remained limited. It also reflects a shift in XDC’s strategy, linking enterprise-focused initiatives with DeFi growth.
Finternet Accelerator Investor Day Set for Singapore
Alongside its DeFi expansion, XDC Network is preparing for a major industry event. Together with T-Hub, XDC will host the Finternet Accelerator Investor Day in Singapore on September 30, 2025.
The event will showcase startups that joined the XDC Finternet Accelerator Program. These projects, backed by partners such as Microsoft, Bitrue, and Klink Finance, will present their ideas to global investors. The agenda also includes panel discussions and networking opportunities to connect entrepreneurs with capital providers.
Organizers emphasized that the program is designed to highlight rising Web3 ventures from India and beyond. By bringing these companies to Singapore, XDC aims to strengthen its global profile while advancing innovation in blockchain-based finance.
Focus on Global Ecosystem Growth
XDC’s dual approach—investing in DeFi platforms like Kasu Finance and supporting early-stage Web3 startups—underscores its focus on ecosystem growth.
The investment builds new links between trade finance and decentralized markets, while the upcoming Investor Day provides visibility to developers working within the XDC ecosystem. Both efforts mark a continued expansion of XDC’s role in global blockchain adoption.
XDC Forms Falling Wedge Pattern With 76% Upside Target
On September 1, 2025, the XDC/USD chart on the 4-hour timeframe showed the formation of a falling wedge pattern. This structure developed as the price moved inside two converging, downward-sloping trend lines. A falling wedge is a bullish reversal pattern that often signals the end of a downtrend and the potential beginning of an upward move.
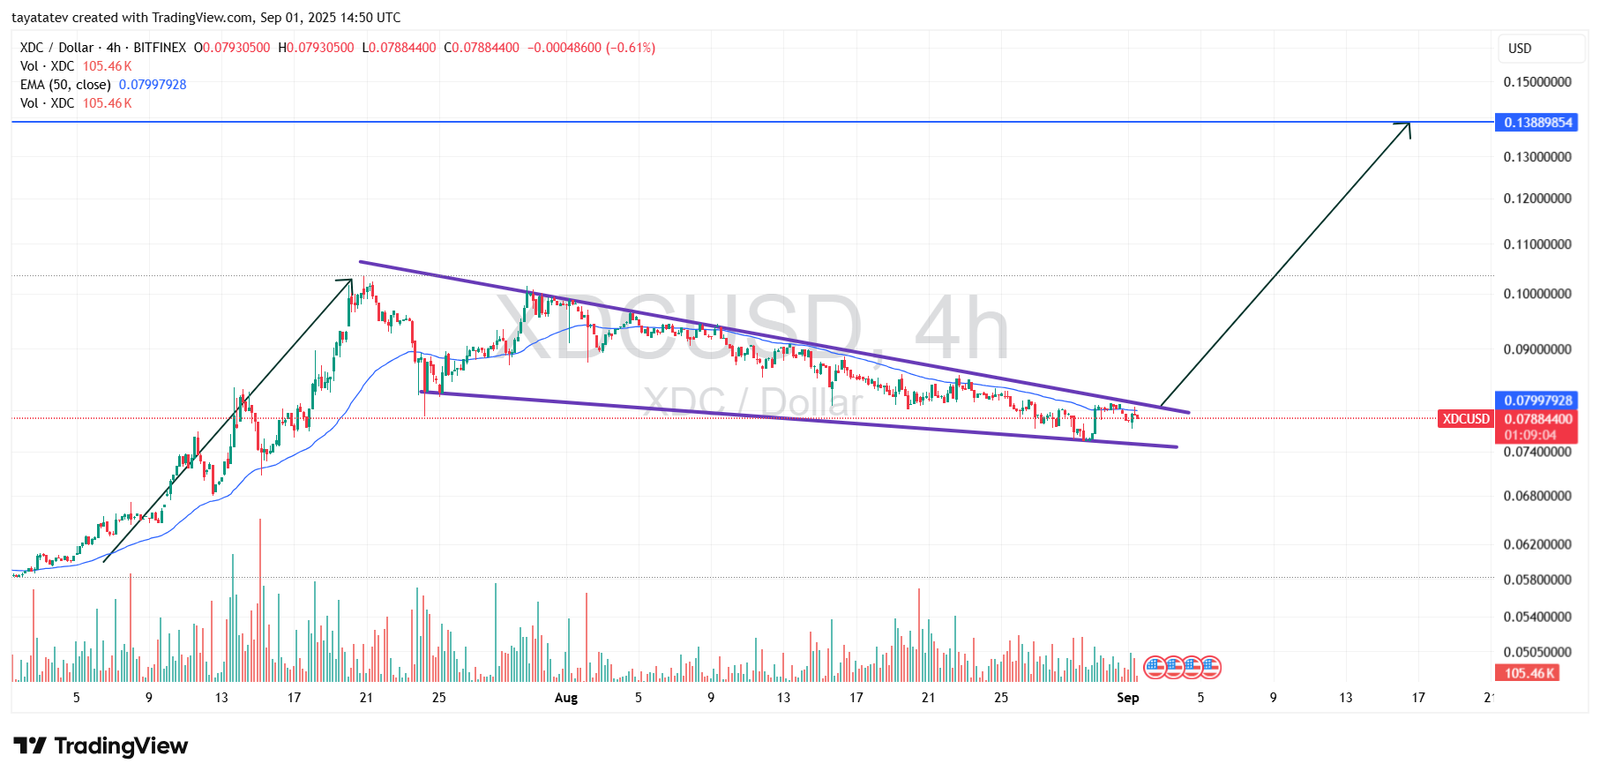
The chart highlighted that XDC had been printing lower highs and lower lows since late July. However, as the wedge narrowed, the price began testing the upper resistance. The 50-period exponential moving average, which currently sits at $0.0799, added pressure at this key level. The positioning of the EMA suggests that a breakout above resistance could confirm the shift in momentum.
If the breakout takes place, the pattern projects a substantial rally. Based on the measured move calculation, the upside target points to a 76 percent gain from the current trading price of $0.0788. This projection places XDC near $0.1389, which matches the horizontal resistance line marked on the chart. The volume profile also supports this outlook, as trading activity shows signs of accumulation during recent lows, a condition that typically strengthens bullish reversal patterns.
With this setup, XDC may be positioned to exit its extended downtrend. A confirmed breakout, backed by volume, could allow the price to climb toward the projected $0.1389 level. The chart therefore indicates that the falling wedge has set the stage for a potential rally if buying momentum continues to build.
XDC RSI Analysis – September 1, 2025
The chart, created on September 1, 2025, shows the Relative Strength Index (RSI) for XDC/USD on the 4-hour timeframe. The RSI line (purple) is currently at 42.96, while the signal line (yellow) stands at 52.91.
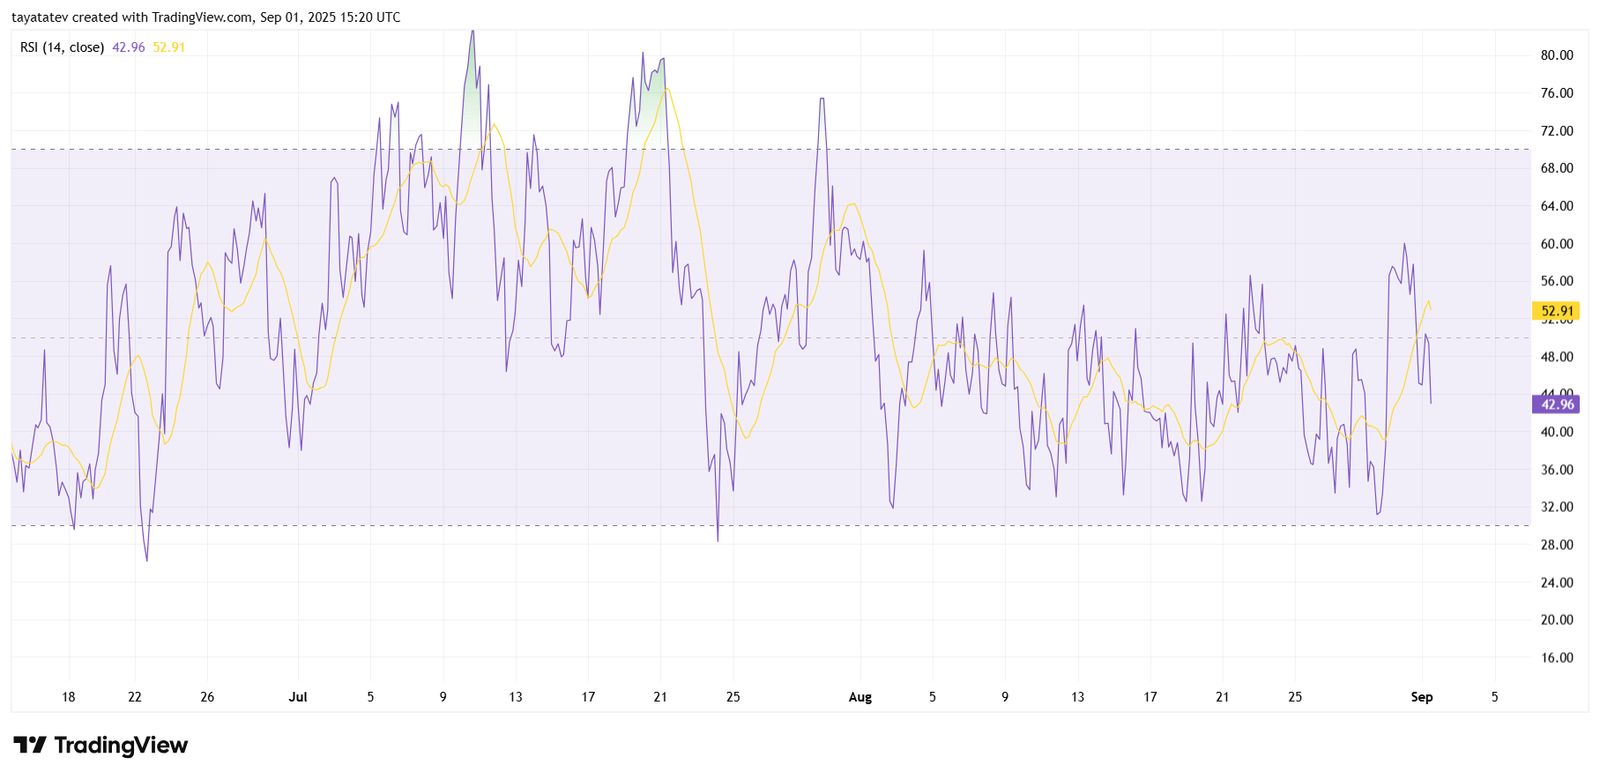
This position places RSI below the midpoint of 50, suggesting that XDC remains in a zone of mild bearish momentum. The repeated swings between 30 and 70 indicate that the asset has traded sideways for weeks without establishing strong directional bias. Each time the RSI approached overbought levels near 70, sellers stepped in, while dips near 30 attracted buyers.
At present, the RSI has pulled back from a recent peak above 60 and now rests near 43. This movement implies that buying pressure has weakened in the short term. However, because the RSI is still above the oversold boundary of 30, XDC has room to recover if demand returns. The divergence between the RSI line and its moving average highlights a short-term cooling of momentum, which traders often interpret as consolidation before the next larger move.
In summary, the RSI suggests that XDC is not yet oversold but continues to consolidate within a wide neutral band. Sustained strength above 50 would signal a shift to bullish momentum, while a drop below 30 would indicate oversold conditions.
XDC MACD Analysis – September 1, 2025
The chart, created on September 1, 2025, shows the Moving Average Convergence Divergence (MACD) indicator for XDC/USD on the 4-hour timeframe. The blue line represents the MACD, the orange line is the signal line, and the histogram shows the difference between the two.
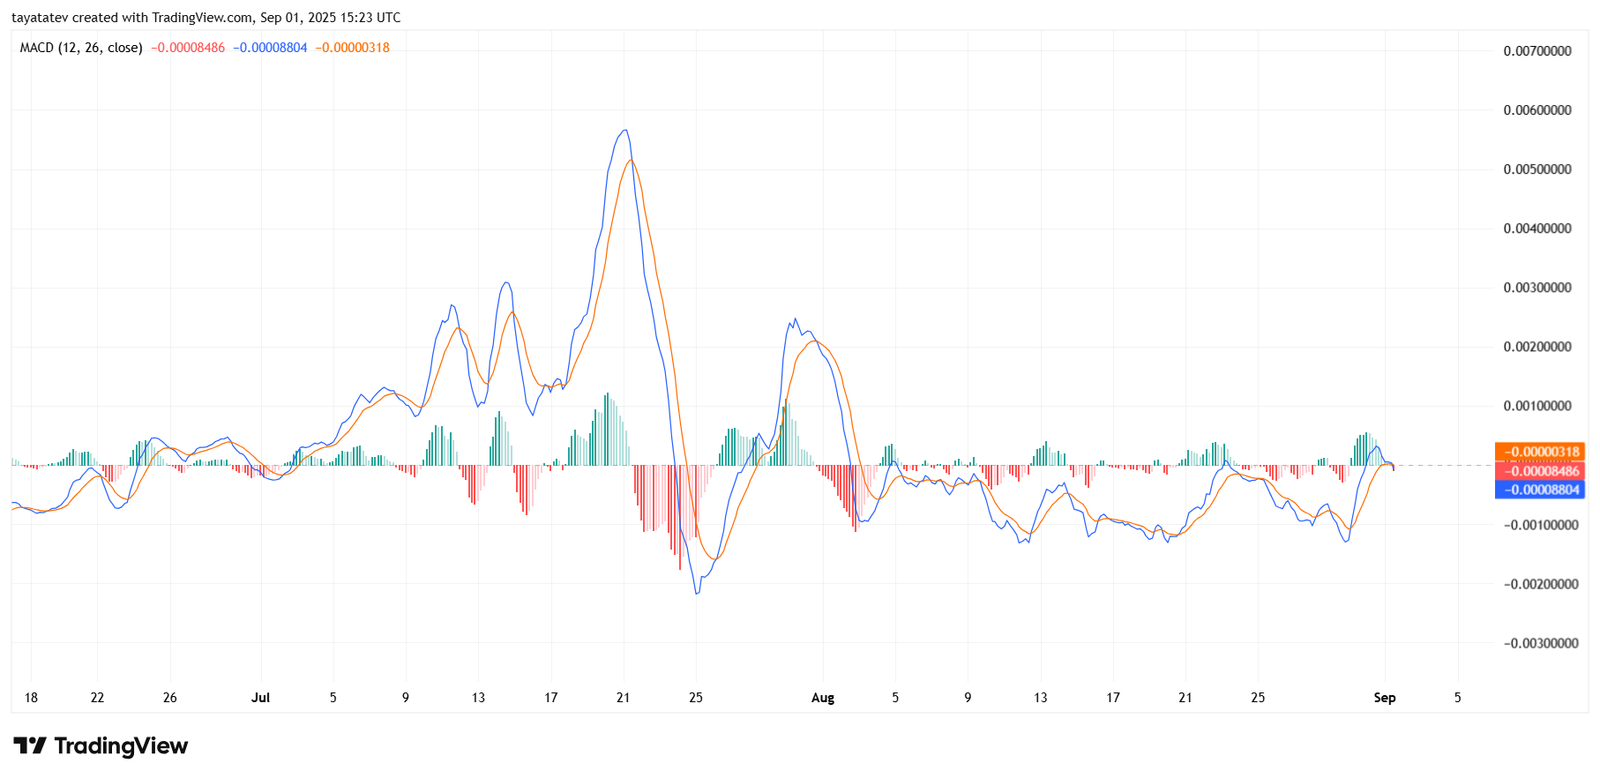
At present, the MACD line stands at -0.00008804, while the signal line is at -0.0000318, with the histogram showing -0.00008486. This alignment indicates that momentum has cooled, as the MACD remains in slightly negative territory. The lines are converging after a recent bearish crossover, hinting that momentum could shift if buyers return.
Earlier in July, the MACD showed strong bullish momentum with peaks well above zero, followed by sharp declines in late July and August. Since then, the indicator has oscillated closely around the zero line, reflecting a period of consolidation. The histogram’s recent reduction in size signals that selling pressure has weakened, leaving room for potential upside.
If the MACD line crosses above the signal line with increasing positive histogram bars, it would confirm a bullish reversal in short-term momentum. On the other hand, failure to hold near the zero line would leave XDC vulnerable to extended consolidation or renewed downside.
