YEREVAN (CoinChapter.com) — As of April 24, XRP price trades at $2.14 after forming a confirmed inverted head and shoulders pattern on the daily chart. This pattern, often seen as a bullish reversal signal, appears when a token forms three consecutive lows with the middle one—the “head”—deeper than the others. The two outer lows are called “shoulders.”

The pattern’s neckline near $2.00 was breached on April 23, confirming the breakout. If XRP holds above this neckline, the price target based on the pattern’s height is near $2.76. This level is marked with a black line on the chart.
The 50-day EMA sits near $2.19, a key level now acting as resistance. XRP price closed below it today, suggesting short-term hesitation. If bulls reclaim that level, upward momentum may continue toward the target.
The RSI (Relative Strength Index) stands at 50.81, indicating neutral conditions. This leaves room for either upward continuation or a pullback.
However, the support at $2.00 must hold. A daily close below it would invalidate the bullish pattern and risk sending XRP down toward the $1.85 area. That level would mark the midpoint of the head and shoulder’s right side.
If XRP maintains strength and stays above the neckline, the $2.76 target remains the primary focus. If not, the structure may flip bearish.
Bearish Indicators Signal Caution Amid XRP’s Rally
Despite XRP’s recent bullish breakout, technical indicators suggest caution. The Chaikin Money Flow (CMF), which measures the volume-weighted money flow into and out of an asset, shows a bearish divergence.
While XRP’s price has risen, the CMF has been trending downward, indicating weakening momentum. Currently, the CMF stands at 0.03 and is approaching the center line, suggesting that the rally may lack solid support from sustained demand.

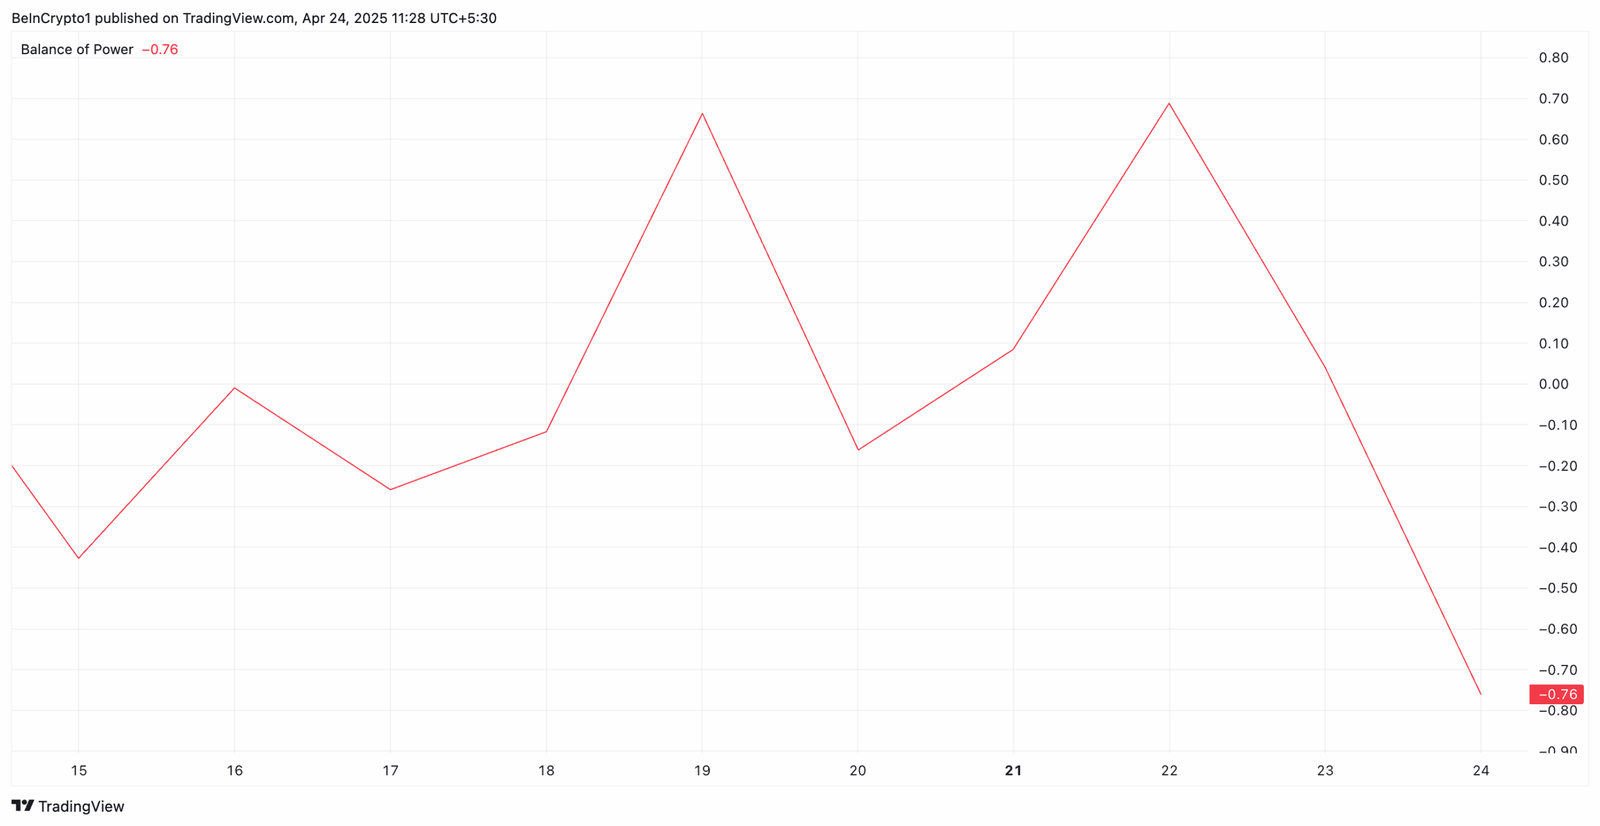
Additionally, the Balance of Power (BoP) indicator is negative at -0.76, highlighting the weakening demand for XRP. A negative BoP suggests sellers exert more influence over price action than buyers, indicating further downside pressure if the trend continues.
ETF Launch and Institutional Backing Reinforce XRP’s Utility
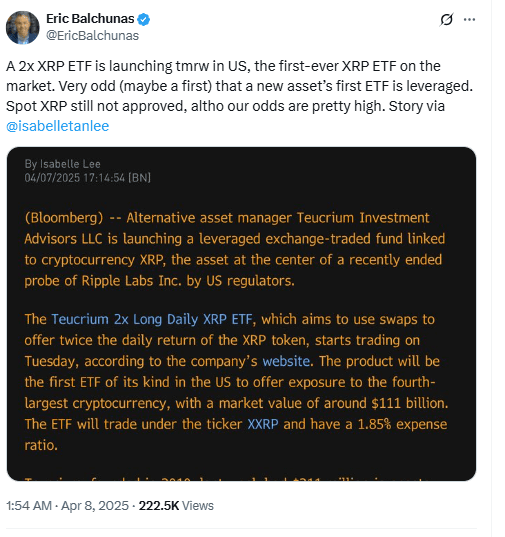
Meanwhile, on April 8, 2025, Teucrium Trading launched the first XRP-based exchange-traded fund (ETF) in the United States, the Teucrium 2x Long Daily XRP ETF, traded under the ticker XXRP on NYSE Arca. This leveraged ETF aims to provide twice the daily return of XRP, offering traders a new vehicle for exposure to the cryptocurrency.
Sal Gilbertie, CEO of Teucrium, emphasized XRP’s practical use case in a recent Bloomberg interview.
“We believe in XRP…We do believe that it’s a coin that will have the most utility out there,”
he stated.
Gilbertie highlighted Ripple’s professional team and XRP’s role in facilitating real transactions, distinguishing it from other cryptocurrencies that are primarily speculative assets.
While Teucrium cannot see its shareholder register in real time, Gilbertie believes early flows reflect “a mix of professionals and retail trading their own accounts.” XXRP is engineered explicitly for intraday traders, he emphasized:, noting:
“This specific product is geared toward traders who have a short-term view—primarily a one-day view—of what XRP’s price moves might be. This allows them in a traditional brokerage account to achieve leverage without a margin account” .
