Key Takeaways:
- Ripple SEC case might come to a wrap as soon as this week, claims a crypto lawyer.
- Meanwhile, XRP prices formed concentric bullish patterns.

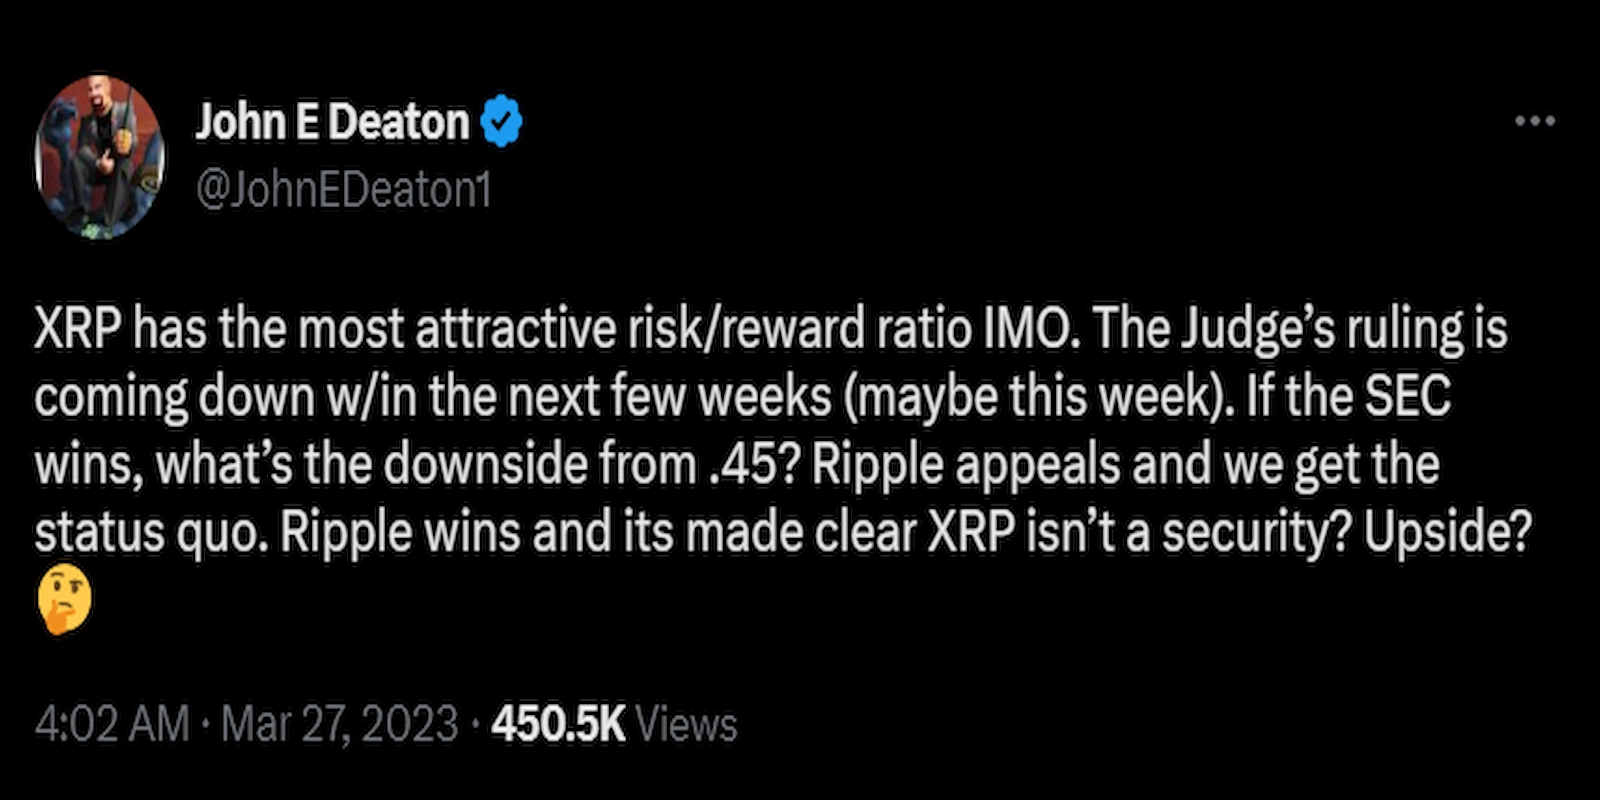
NEW DELHI (CoinChapter.com) — The Ripple SEC case might be close to reaching a verdict soon, according to crypto lawyer John E. Deaton. Furthermore, the lawyer stated that XRP might have the “most attractive risk/reward ratio,” in his opinion.
Deaton added that a ruling from Judge Analisa Torres of the Southern District Court of New York might arrive by the end of this week. The forecast aligns with Ripple CEO Brad Garlinghouse’s prediction of the XRP SEC settlement by April.
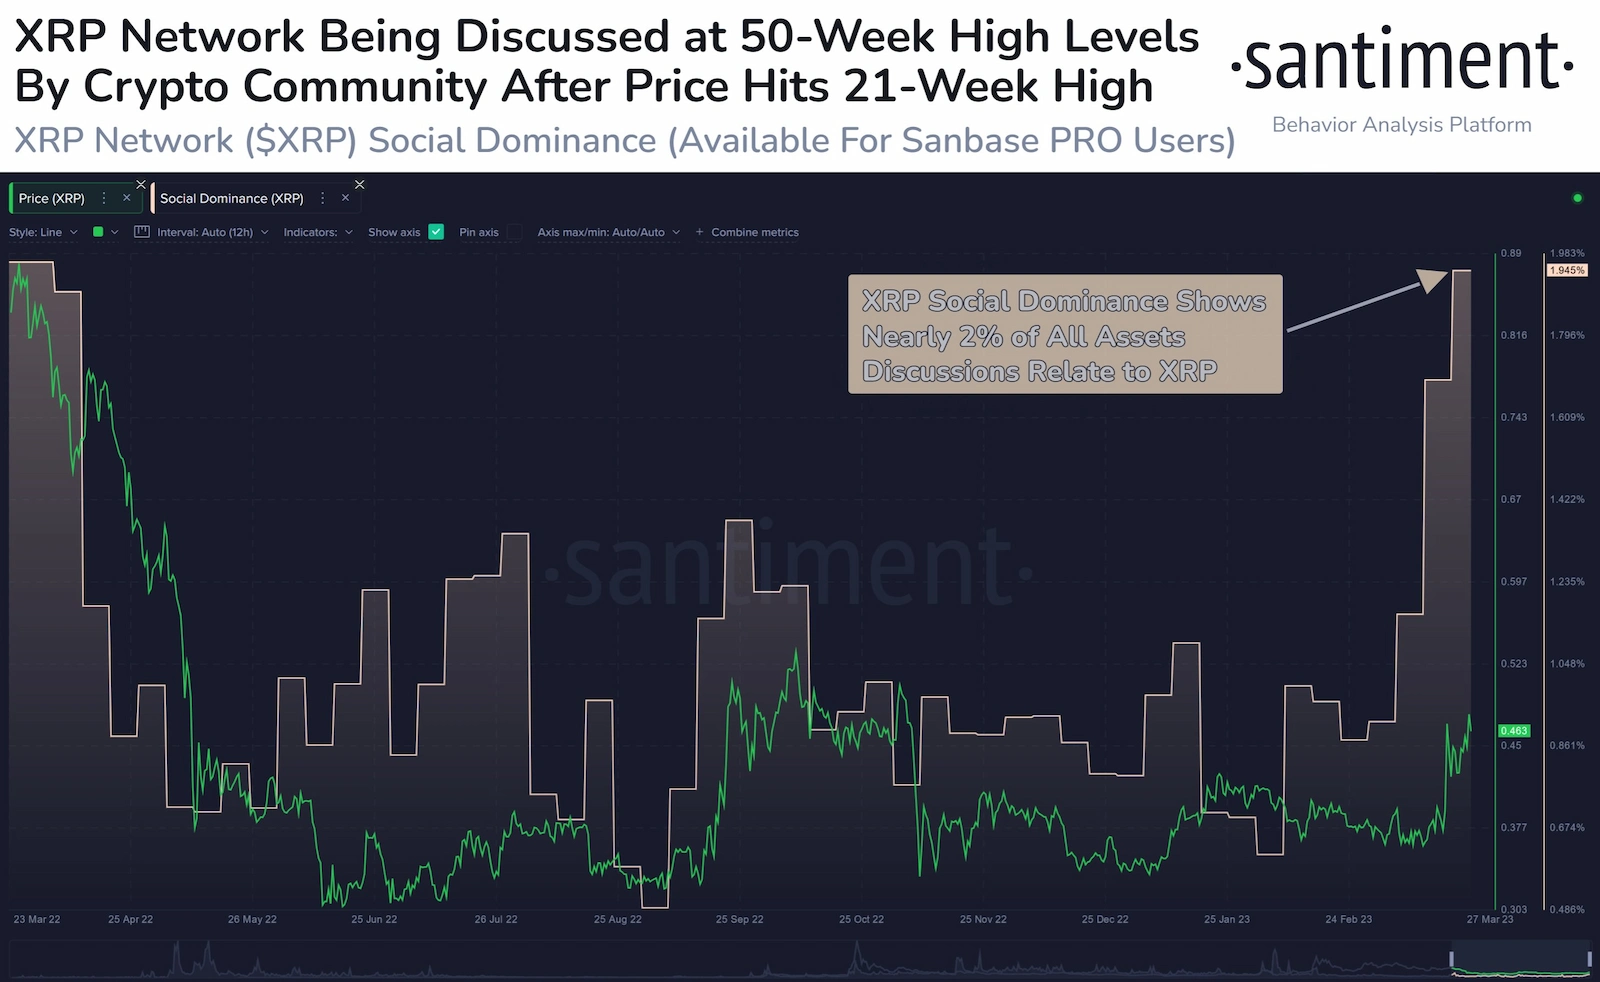
Meanwhile, the XRP price seems to benefit from the speculation of the Ripple SEC case verdict. Blockchain analysis firm Santiment noted that social dominance for the Ripple token was at its highest point in a year.
Furthermore, a verdict in the XRP lawsuit might put the Ripple token at a “sell the news” risk. Traders seem to be buying the token in anticipation of profiting from a positive outcome of the XRP lawsuit. Hence, a selling spree could occur after the Ripple SEC settlement.
Additionally, a negative outcome in the XRP vs. SEC could act as a bearish cue, as traders would likely dump their XRP tokens to mitigate their losses.
XRP Price Forms Bullish Patterns
Meanwhile, XRP formed a bullish pattern called the falling wedge.
In detail, the technical pattern forms when the price fluctuates inside a pair of falling trendlines that would converge down the slope. The outcome of such downside patterns is typically a price breakout to the upside.
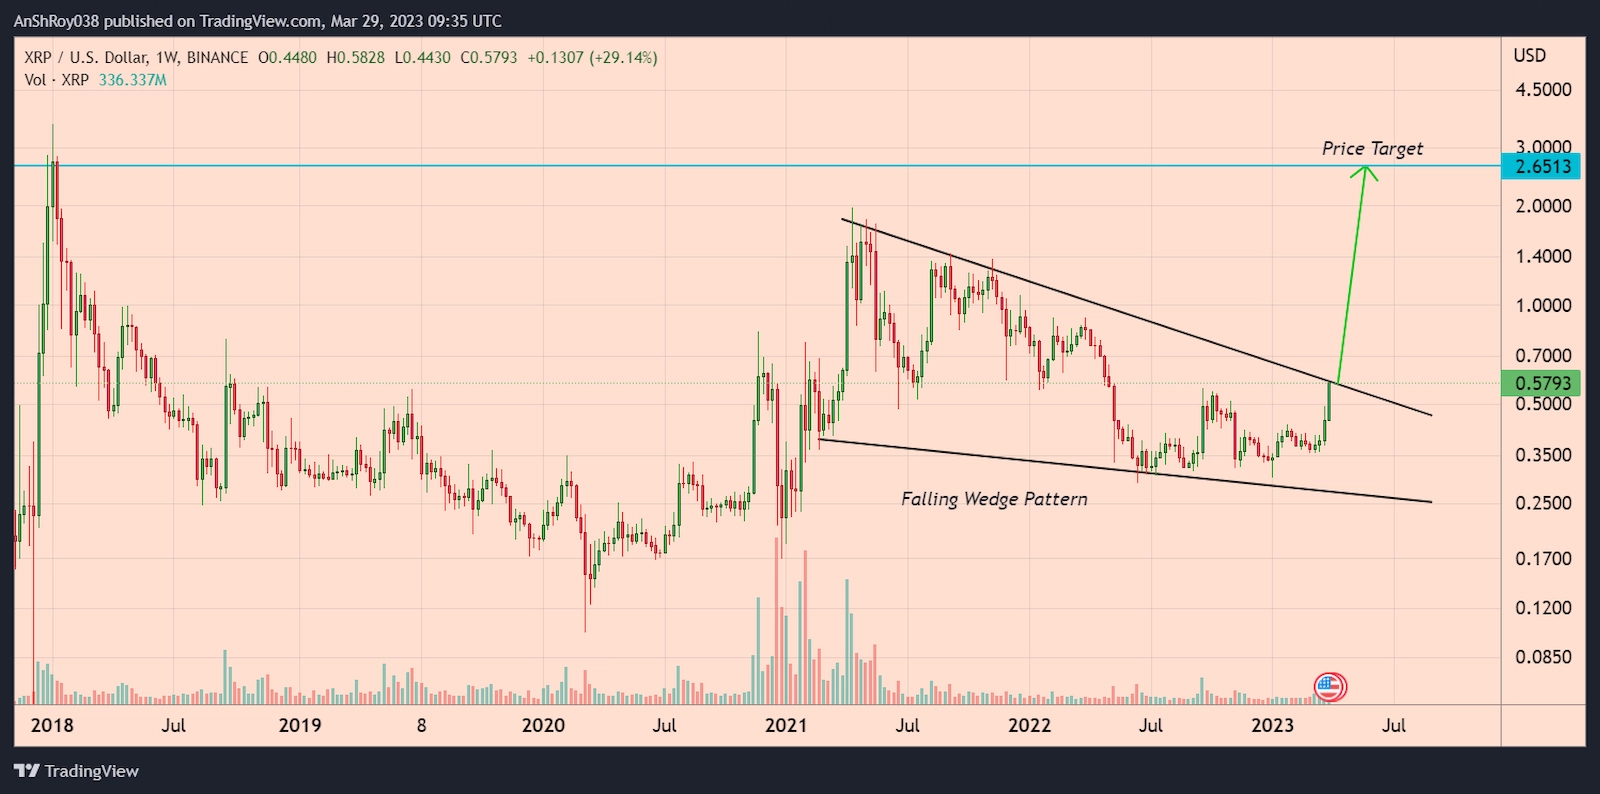
One key feature of the pattern is that volumes usually decline as the trendlines converge.
The upside target for the breakout is equal to the maximum distance between the falling wedge’s upper and lower trendlines. Hence, XRP looks poised to spike 357% to $2.65 if XRP confirms the pattern with sufficiently high volumes.
Also Read: Disney (NYSE: DIS) Kills Metaverse Division As Sector Sees Firms FleeingInterestingly, zooming out on the XRP chart shows the Ripple token price is moving inside another bullish continuation pattern called the bull pennant. The pattern emerges when an asset consolidates between two converging trendlines after a price rally.
Ultimately, a breakout in the direction of the large initial movement follows the period of consolidation.
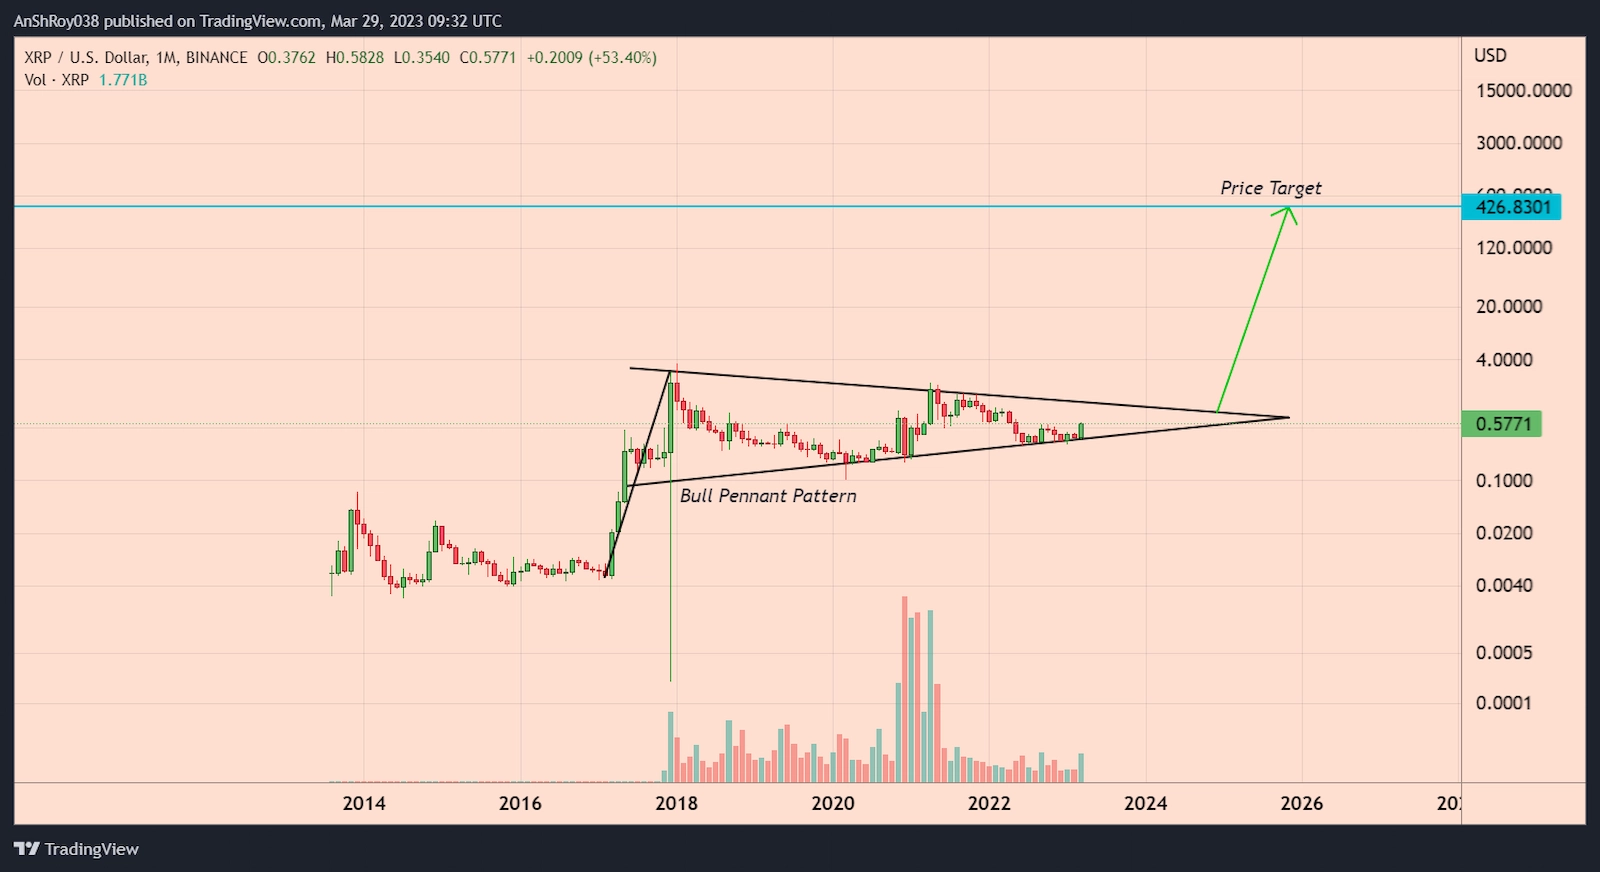
Volume is important in the pattern. During consolidation, the volume should be low while it must increase during the breakout move. Otherwise, prices would likely pull back into the consolidation pattern.
Per the rules of technical analysis, XRP might rise to $427, a jump of 73,486% from current levels.
XRP Price Reach A Multi-Month High
The recent bull run of the XRP price saw the Ripple token breach above $0.58 for the first time since May 2022. Moreover, XRP’s rally helped the token record its highest monthly gains since Aug 2022, with two days to spare in March 2023.
The Ripple token spiked nearly 13.6% on March 29 to reach a high of $0.585. However, bears aggressively defend the $0.59 resistance level, forcing XRP to pare gains. In addition, the long upper wicks on the token’s recent daily candles underscore the bearish pressure on the Ripple token.
A break and hold above immediate resistance could help XRP price reach resistance near $0.64 before retreating.
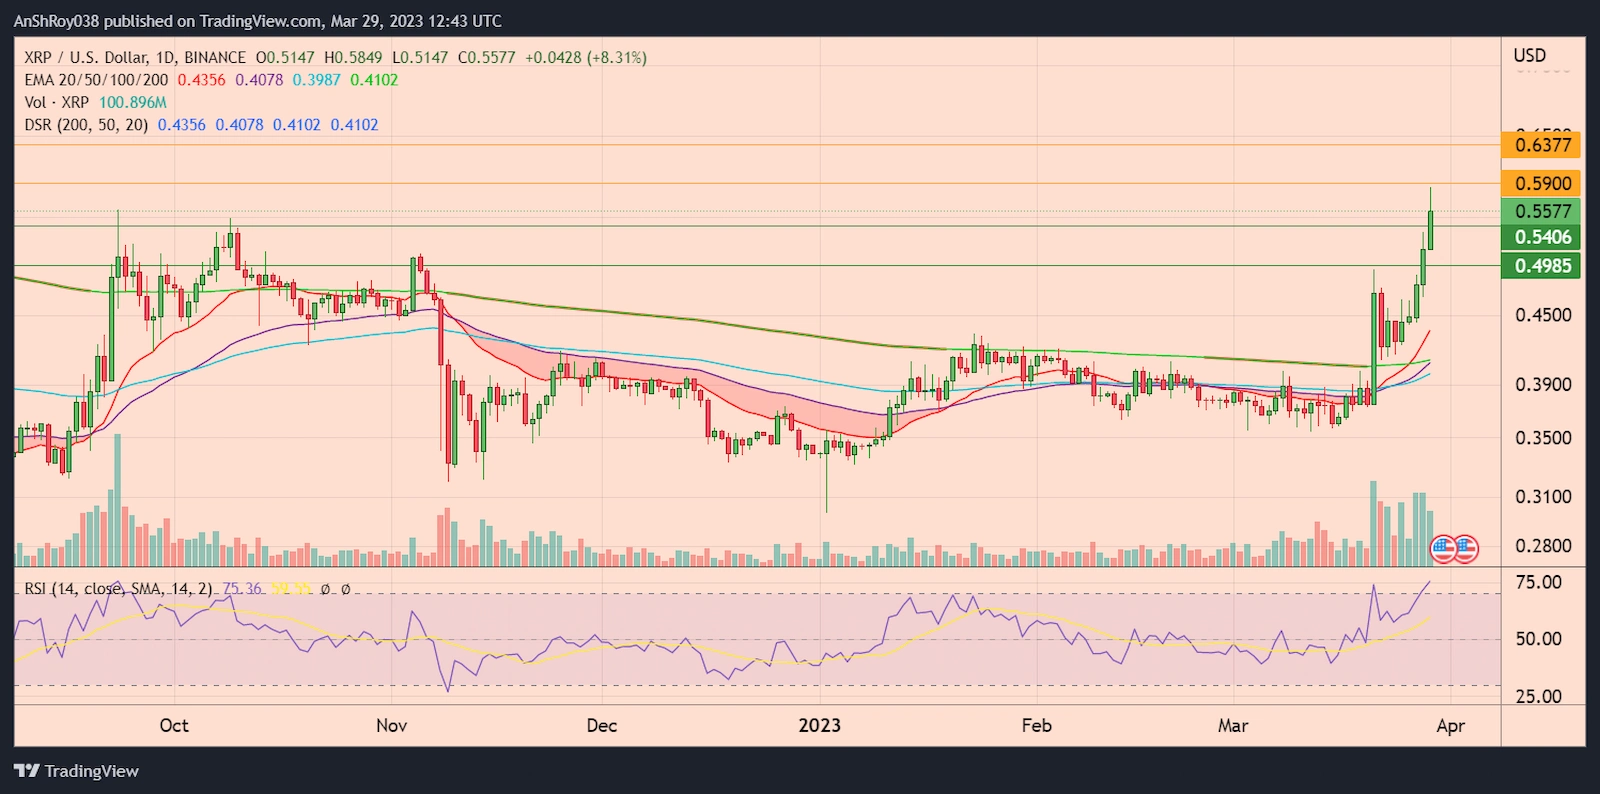
The bull run pushed XRP’s RSI into the overbought level, currently clocking at 75.36, which might have attracted sellers to the market. Traders consider overbought RSI levels a sign of impending trend reversal and a sell signal.
If XRP recedes, the Ripple token might drop to support near $0.54. Breaching immediate support might see the XRP price drop to test support near $0.5 before recovering.

… [Trackback]
[…] Info on that Topic: coinchapter.com/xrp-news-ripple-sec-case-might-wrap-up-this-week-claims-lawyer-as-xrp-forms-bullish-patterns/ […]
Nice post. I learn something new and challenging on blogs I stumbleupon on a daily basis.
It will always be exciting to read articles from
other writers and use a little something from their websites.
… [Trackback]
[…] Find More on on that Topic: coinchapter.com/xrp-news-ripple-sec-case-might-wrap-up-this-week-claims-lawyer-as-xrp-forms-bullish-patterns/ […]
… [Trackback]
[…] Information on that Topic: coinchapter.com/xrp-news-ripple-sec-case-might-wrap-up-this-week-claims-lawyer-as-xrp-forms-bullish-patterns/ […]