XRP price started a downside correction below the $3.00 support. The price is now below the 50-day simple moving average and might extend losses.
XRP Price Dips Below Key Trend Line
In the last technical analysis, we saw a downside correction in XRP from the $3.650 zone. The price declined below the $3.250 and $3.150 support levels before the bulls appeared near the 50-day simple moving average (blue). However, the recent bearish moves in Bitcoin sparked more losses.
The bears were able to push the price below the $3.00 support and the 50-day simple moving average (blue). These are now warning signs and suggest high chances of more downside.
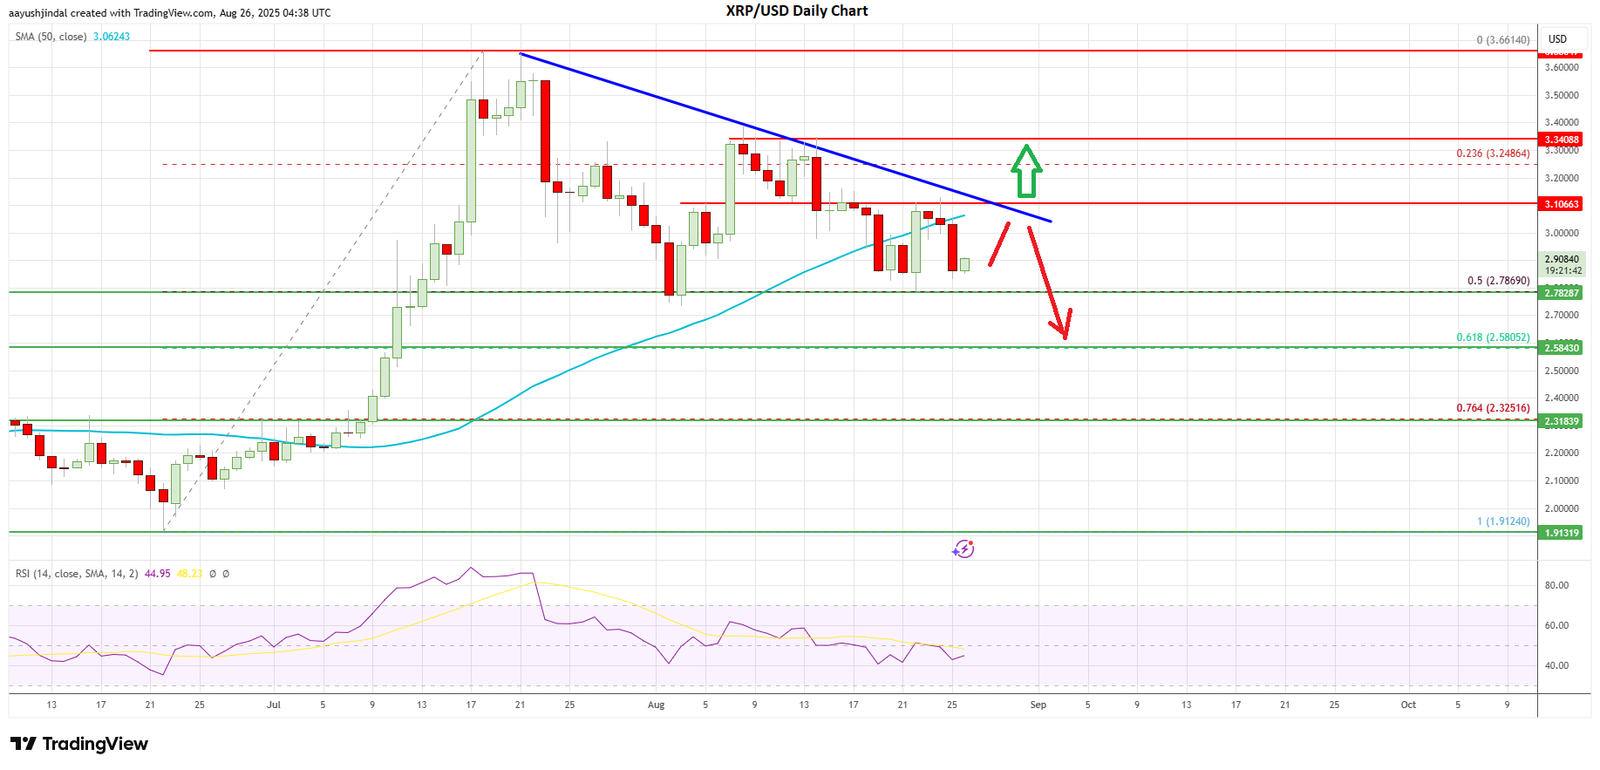
XRP price is now trading just above the 50% Fib retracement level of the upward move from the $1.9124 swing low to the $3.6614 high, and well below the 50-day simple moving average (blue).
Besides, there is a key bearish trend line forming with resistance at $3.10 on the daily chart. If the bulls remain active above the $2.78 support, the price could attempt to recover. Immediate resistance on the upside is near the $3.00 level. The first major resistance is near the $3.10 level, the 50-day simple moving average (blue), and the trend line.
A close above the $3.10 level could open the doors for a steady increase. In the stated case, the price could rise toward the $3.250 level. The next resistance is near the $3.350 level, above which the price could accelerate higher toward the $3.50 resistance. Any more gains might open the doors for a move toward the $3.650 zone.
More Losses?
Conversely, XRP could fail to start a recovery wave and might continue to move down. Immediate support is near the $2.78 level. A daily close below the $2.780 support could send the price further lower.
The first major support below $2.780 is the 61.8% Fib retracement level of the upward move from the $1.9124 swing low to the $3.6614 high at $2.580. If the bears push the price below $2.580, the price could gain bearish momentum.
In the stated scenario, the price could decline below $2.450. The main support could be $2.3250. If there is a clear move below the $2.3250 support, the price could dive and test $2.20. Any more losses could send the price toward the $2.050 support zone.
Overall, the XRP price shows bearish signs below $3.00 and $3.10. If the bears remain active, the price could slide toward $2.580 or even $2.3250. On the upside, a close above $3.10 could decrease the current selling pressure.
