Key Takeaways:
- Radix trades nearly 90% below its record high.
- The token eyes further price declines in the coming weeks.
- However, long term, it is preparing to undergo a bullish reversal.
YEREVAN (CoinChapter.com) — The market valuation of Radix (XRD), a decentralized finance platform, has almost doubled in 2023. Still, it remains nearly 90% below its market peak of $4 billion in June 2021, underperforming most peers in the crypto space.
So should investors buy XRD in 2023? Let’s discuss.
Radix Price Could Crash 20% in July-August.
From a technical perspective, the XRD price risks crashing by 20% in the coming weeks.
Notably, the Radix token has fluctuated inside what appears to be a ‘falling wedge‘ pattern. Traditional analysts view the falling wedge as a bullish reversal pattern, realized when the price breaks above the upper trendline and resolved when it rises by as much as the wedge’s maximum height.
As a result, XRD may break out to the upside in 2023. But from a short-term perspective, the token gets to face losses first.
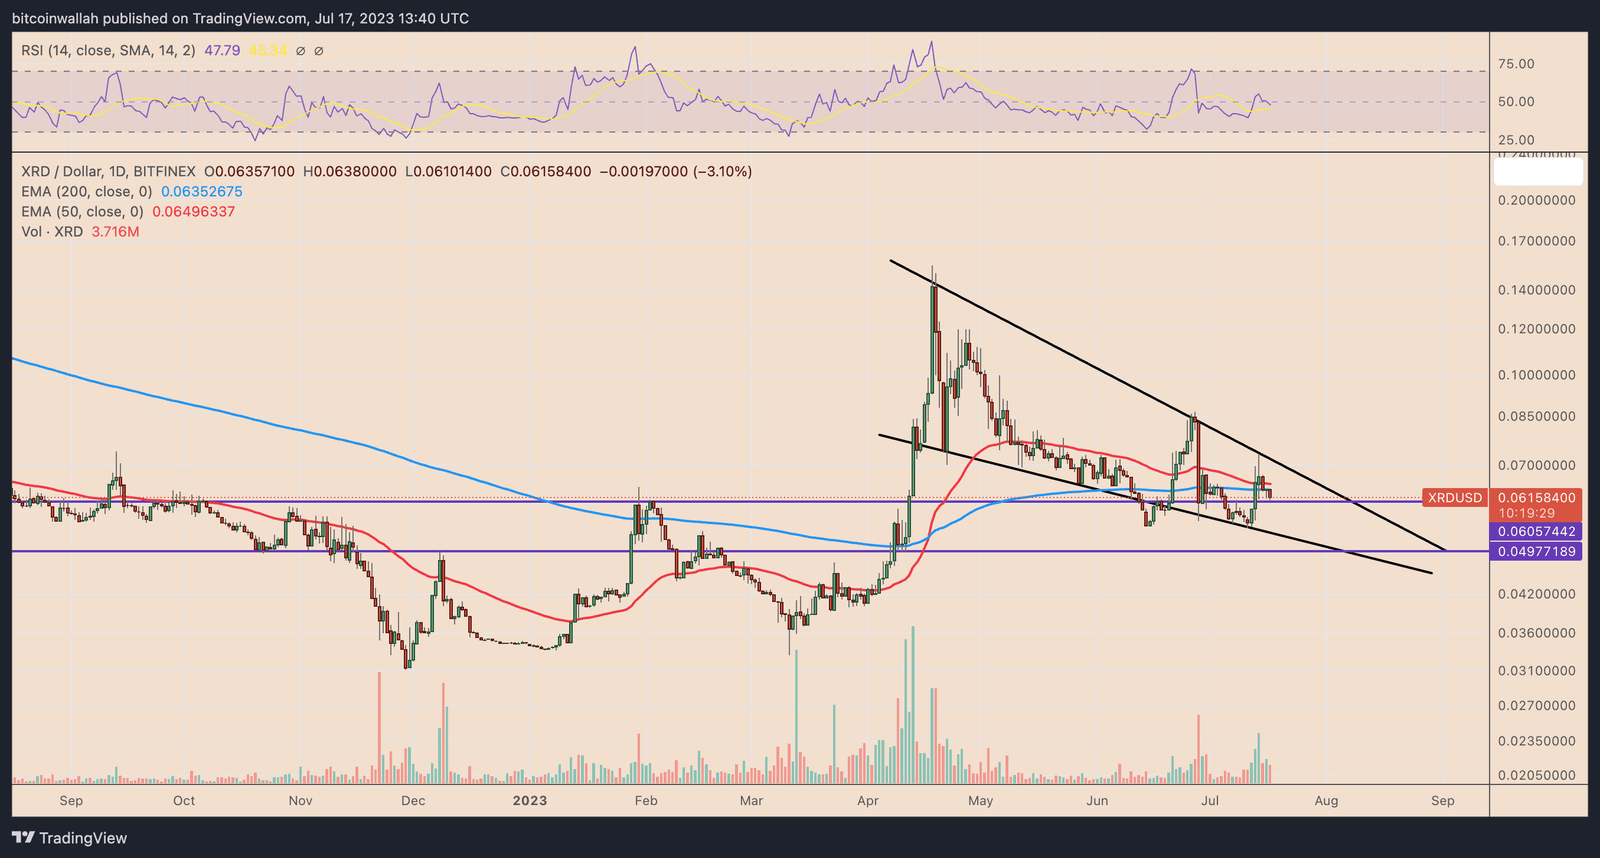
That is because XRD has failed to register a breakout move in its previous run-up to the wedge’s upper trendline. Moreover, the token has dropped by nearly 16.5% after testing the trendline, flipping its key moving average supports, confirming a strong bearish rejection by traders.
So, the Radix price eyes an extended correction toward the wedge’s lower trendline near $0.049 in July or by August, down 20% below the current price levels.
The XRD Price Breakout Scenario
Conversely, suppose the XRD price breaks out of the falling wedge. Then, depending on the breakout point, the token can rise to anywhere between $0.079 and $0.125 in 2023. In other words, a 30%-100% rally by the year’s end.
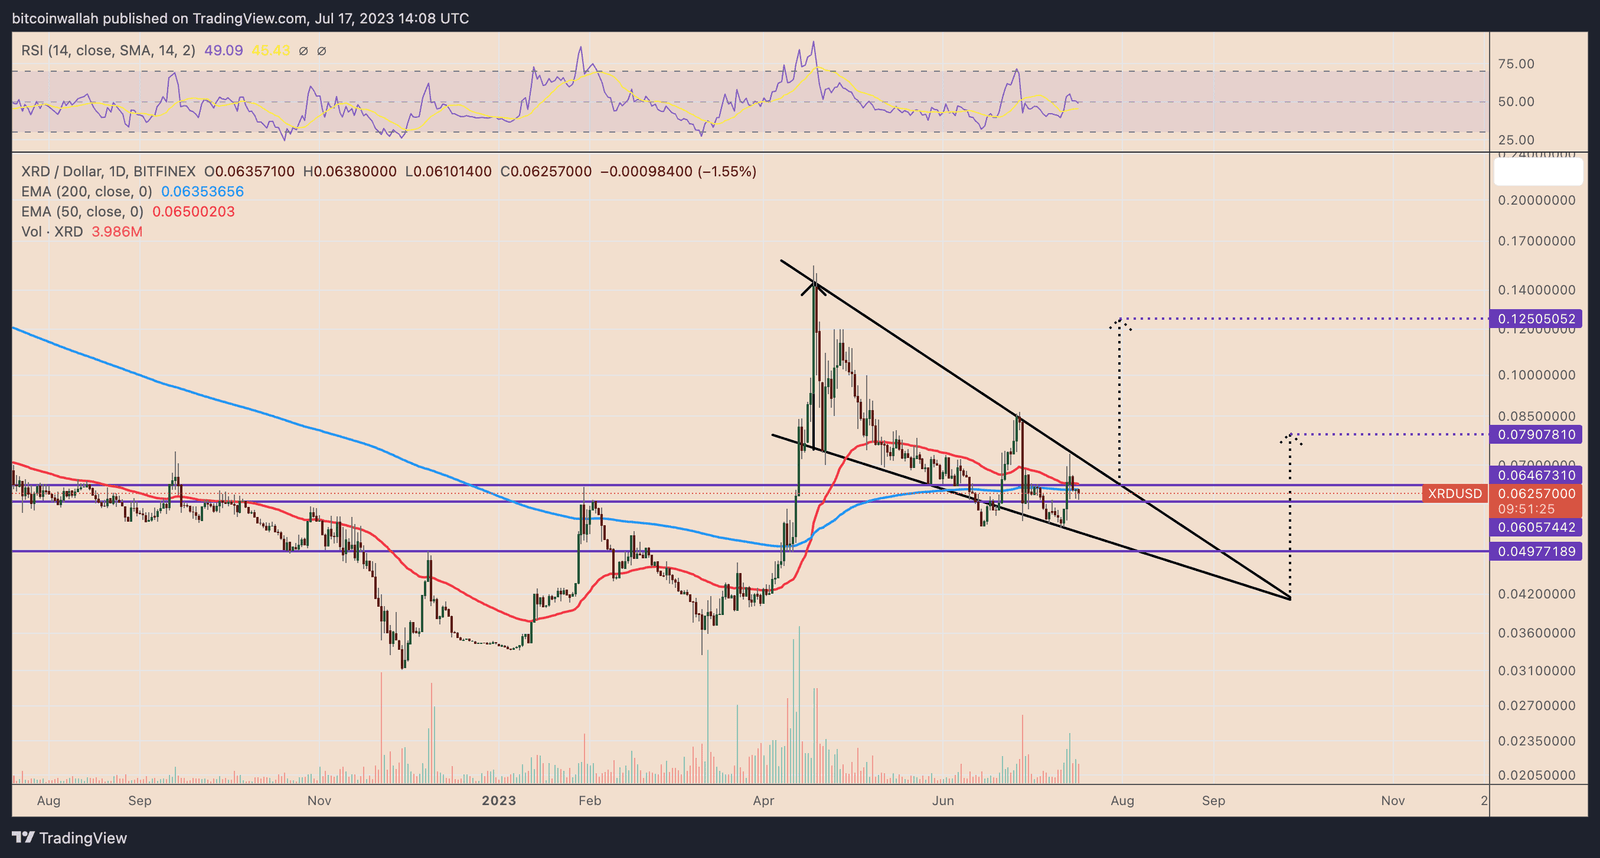
Strategically, traders can wait for a high-volume bounce from XRD’s upcoming support levels, the first being $0.060, to enter a long position toward the wedge’s upper trendline. However, maintain a risk strategy by opening a stop loss position below the entry point.
That ‘Babylon’ Upgrade
Traders can look for intraday opportunities around Radix’s upcoming network upgrade called “Babylon” on July 31.
Babylon upgrade date confirmed: July 31st 2023.
The upgrade from Olympia to Babylon will pave the way for global Web3 & DeFi to finally exit the “tech demo” stage with a mainstream-capable user and developer experience.
Read more: https://t.co/XSRWWoLobE
— Radix – Radically Different DeFi (@radixdlt) April 11, 2023However, one should ensure maintaining stop losses opposite to the direction of their trades.

… [Trackback]
[…] Here you will find 33398 additional Info to that Topic: coinchapter.com/ta-is-radix-xrd-still-a-buy-after-rising-85-in-2023/ […]
… [Trackback]
[…] There you will find 96575 more Info on that Topic: coinchapter.com/ta-is-radix-xrd-still-a-buy-after-rising-85-in-2023/ […]
… [Trackback]
[…] There you will find 11562 additional Information to that Topic: coinchapter.com/ta-is-radix-xrd-still-a-buy-after-rising-85-in-2023/ […]