On June 5, 2025, the launch of RLUSD alongside XRP marked a major shift in cross-border finance. Market analyst Pumpius stated the XRP–RLUSD pairing is not just another token bridge—it is a direct challenge to legacy systems like SWIFT, Fedwire, and traditional capital controls. The structure is designed to operate independently from U.S. monetary oversight.
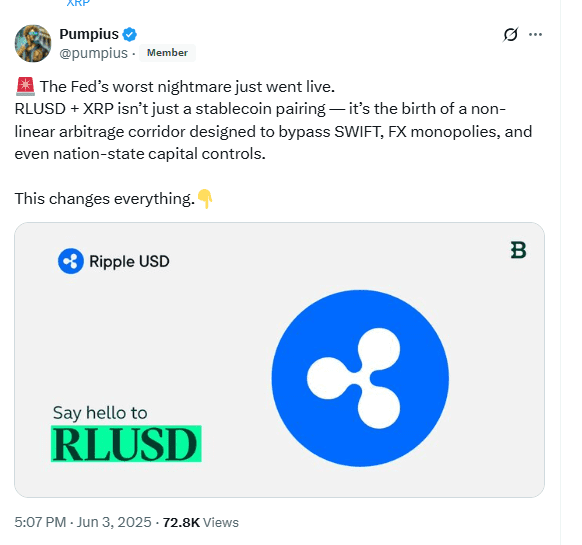
Unlike dollar-pegged stablecoins backed by Treasury bills or custodial reserves, RLUSD functions as a synthetic U.S. dollar. It stays stable, fully decentralized, and operates off-chain. This unique design removes reliance on Wall Street intermediaries.
According to economist Victor Ramires, RLUSD secures its peg outside U.S. jurisdiction. That eliminates typical regulatory friction and builds an alternative monetary system. Within this framework, XRP acts as the central liquidity engine. It clears cross-border settlements in real time across fragmented foreign exchange networks, bypassing delays and slippage common in traditional systems.
FX strategist Meera Takashi emphasized that XRP and RLUSD enable more than simple swaps. Together, they create “dynamic FX symmetry,” a mechanism that absorbs volatility while arbitraging mispriced currencies. This continuous process compresses bid/ask spreads and removes the need for legacy clearing agents. The system neutralizes market fragmentation using XRP’s programmable liquidity.
Institutional and Sovereign Adoption Expands Rapidly
RLUSD operates on both the XRP Ledger (XRPL) and Ethereum. It uses a burn-to-mint bridge to maintain circulation balance. The stablecoin already powers lending on Aave and trades on exchanges like BitMEX. Ripple-backed trials for real-time philanthropic settlements have processed $25 million in RLUSD.
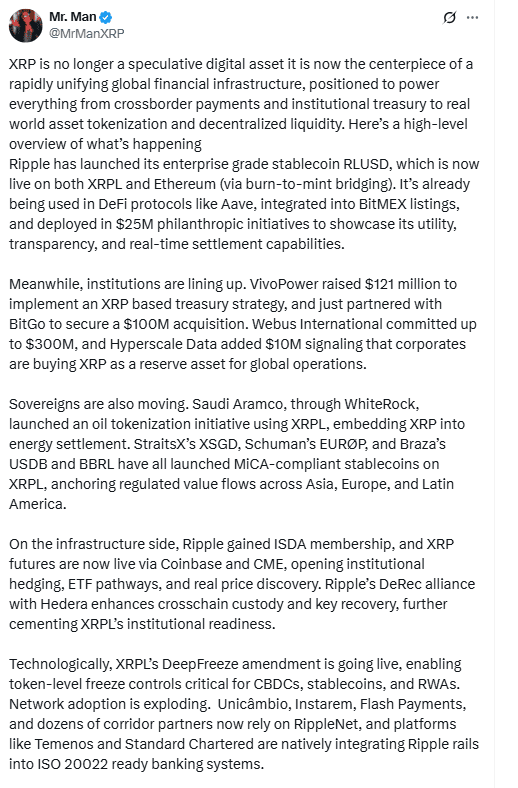
Institutional involvement has surged. VivoPower secured $121 million for an XRP-based treasury model and closed a $100 million deal with BitGo. Webus International pledged up to $300 million, while Hyperscale Data added $10 million in token reserves.
Sovereign actors are following. Saudi Aramco tokenized oil via WhiteRock and XRPL, linking energy to the Ripple ecosystem. Meanwhile, regulated regional stablecoins like XSGD, EURØP, and USDB launched on XRPL. These support localized compliance while anchoring value within national borders.
XRP Anchors a Multipolar Ledger System
Ripple’s infrastructure continues to expand. XRP futures now trade on both Coinbase and the Chicago Mercantile Exchange (CME). The DeRec alliance with Hedera supports cross-chain custody and account recovery. Meanwhile, Ripple’s new DeepFreeze amendment will help central banks manage central bank digital currencies (CBDCs) and real-world assets (RWAs) on-chain with stricter compliance controls.
Financial networks like Unicâmbio, Instarem, and Flash Payments have launched payment corridors through RippleNet. Standard Chartered is also integrating Ripple Rails into ISO 20022 frameworks. These moves push XRP further into regulated banking structures, extending its reach beyond crypto-native systems.
As programmable liquidity and regulatory compliance merge, XRP and RLUSD now form the backbone of a unified, cross-border settlement network.
This evolving structure could replace the legacy financial rails and reshape the global monetary landscape.
XRP/USD Forms Bullish Flag Pattern With 29% Breakout Target
On June 5, 2025, the XRP to United States Dollar (XRP/USD) pair formed a bullish flag pattern on the 4-hour chart.
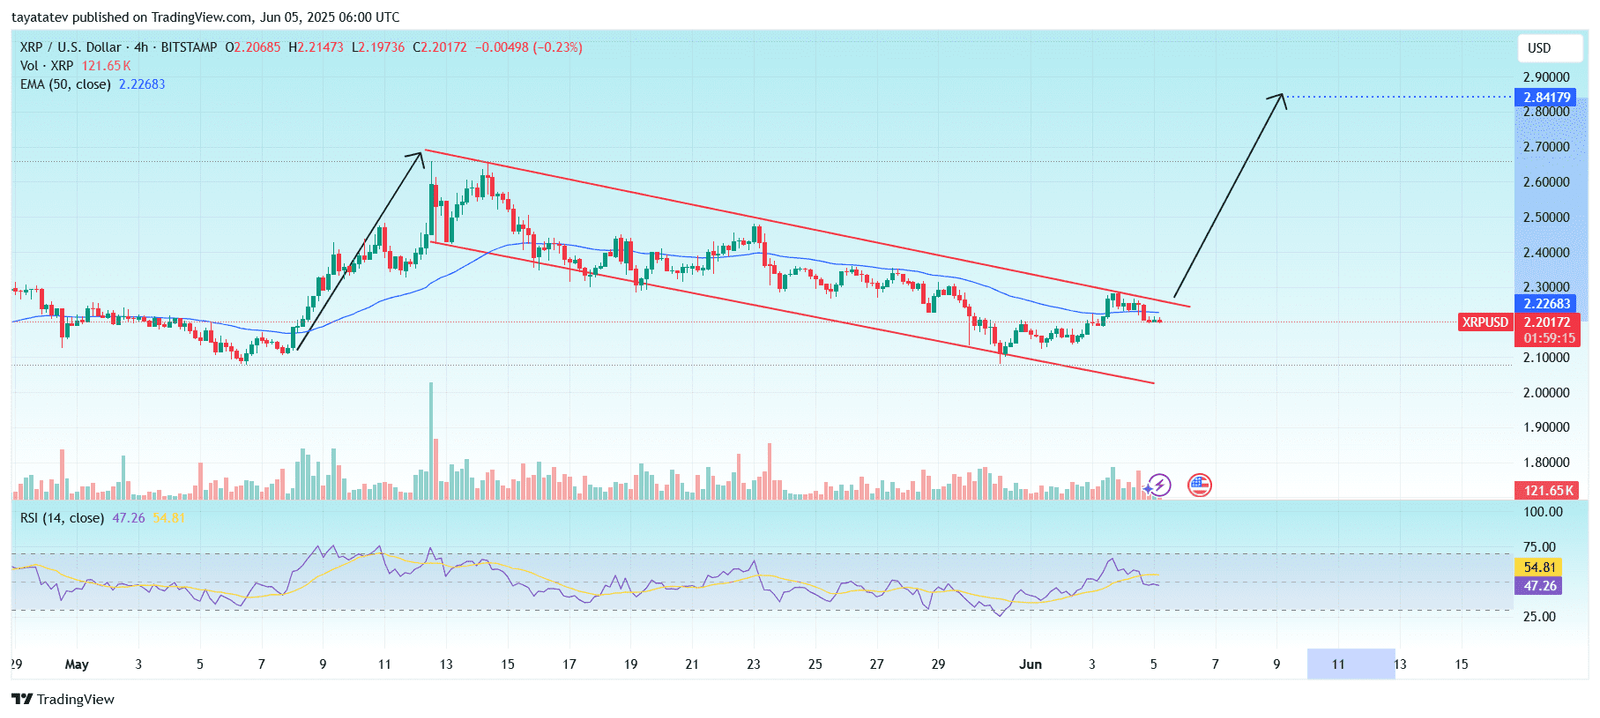
A bullish flag pattern appears after a strong upward price movement, followed by a tight downward-sloping consolidation between parallel lines. This structure often signals a continuation of the prior uptrend once the price breaks above the flag’s resistance.
If this pattern confirms, XRP/USD could rise 29 percent from the current price of $2.20172 to the projected target of $2.84179.
Currently, XRP/USD trades below the 50-period Exponential Moving Average (EMA), which stands at $2.22683. This EMA acts as dynamic resistance. The price must close above both the EMA and the red flag resistance line to confirm the breakout.
Relative Strength Index (RSI), set to a 14-period close, now reads 47.26. It has dropped slightly from the recent local peak of 54.81, signaling weakening upward momentum. However, if RSI rebounds above 50 with volume increasing, this would support a bullish breakout.
Volume remains moderate around 121.65K. For the bullish flag to confirm, XRP needs a strong candle close above the flag’s upper boundary with increased volume. If that happens, buyers may take control and push the price toward the $2.84 area.
The previous pole, formed during the steep rally from May 6 to May 10, provides the basis for the projected target. As long as the structure holds and price stays inside the flag, this setup remains valid.
XRP/USD MACD Indicator Shows Fading Bullish Momentum
On June 5, 2025, the Moving Average Convergence Divergence (MACD) indicator for the XRP to United States Dollar (XRP/USD) pair reflected a potential shift in short-term momentum.
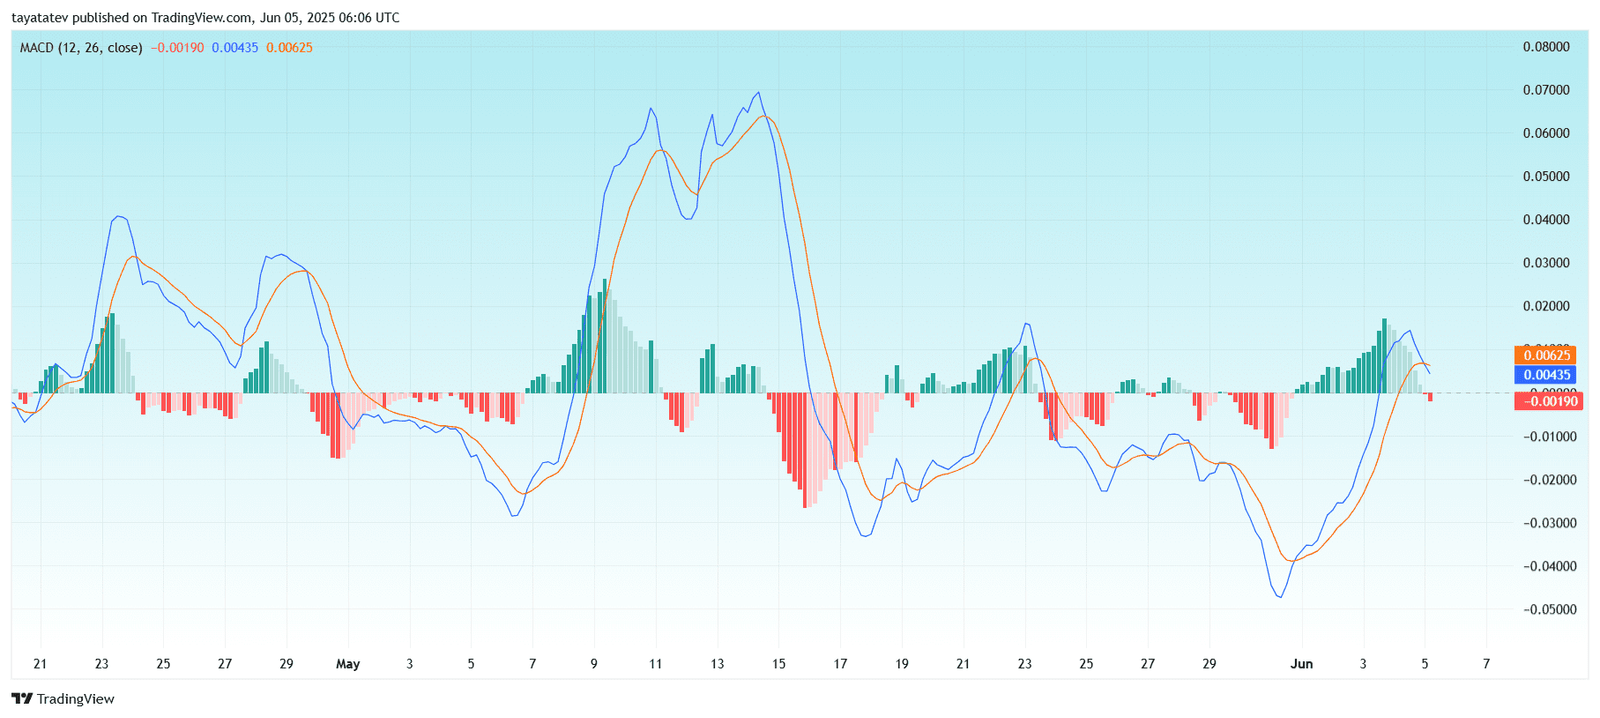
Currently, the MACD line (blue) stands at 0.00435, while the signal line (orange) is at 0.00625. The MACD histogram reads −0.00190, which has just turned red. This indicates that the MACD line has crossed below the signal line.
The crossover suggests that the recent bullish momentum is weakening. After several days of upward pressure and expanding green bars in early June, the histogram has now started printing red bars. This shift often acts as a short-term bearish signal.
Prior to this, the MACD line had sharply risen from negative territory on June 1, following the May 30 bottom. This strong upward crossover supported the rally attempt seen on the price chart. However, as of now, the flattening of both lines and the new red histogram suggest momentum divergence.
If this downtrend continues, the MACD could signal a deeper pullback unless price action reverses quickly. Traders often wait for confirmation from volume or other indicators like the Relative Strength Index (RSI) before acting.
