
XRP price action shows a potential rebound signal as the TD Sequential indicator prints a “9” buy setup on the 9-hour chart. The tool, tracked by market analyst Ali (@ali_charts), previously marked the local top with accuracy, signaling a sell setup at the $3.40 zone earlier in August.
The indicator counted nine consecutive bearish candles, ending with a potential exhaustion point at $2.85. This sequence has historically suggested short-term reversals when appearing after extended downtrends. On August 20, the buy setup coincided with XRP consolidating near support just under $2.90.
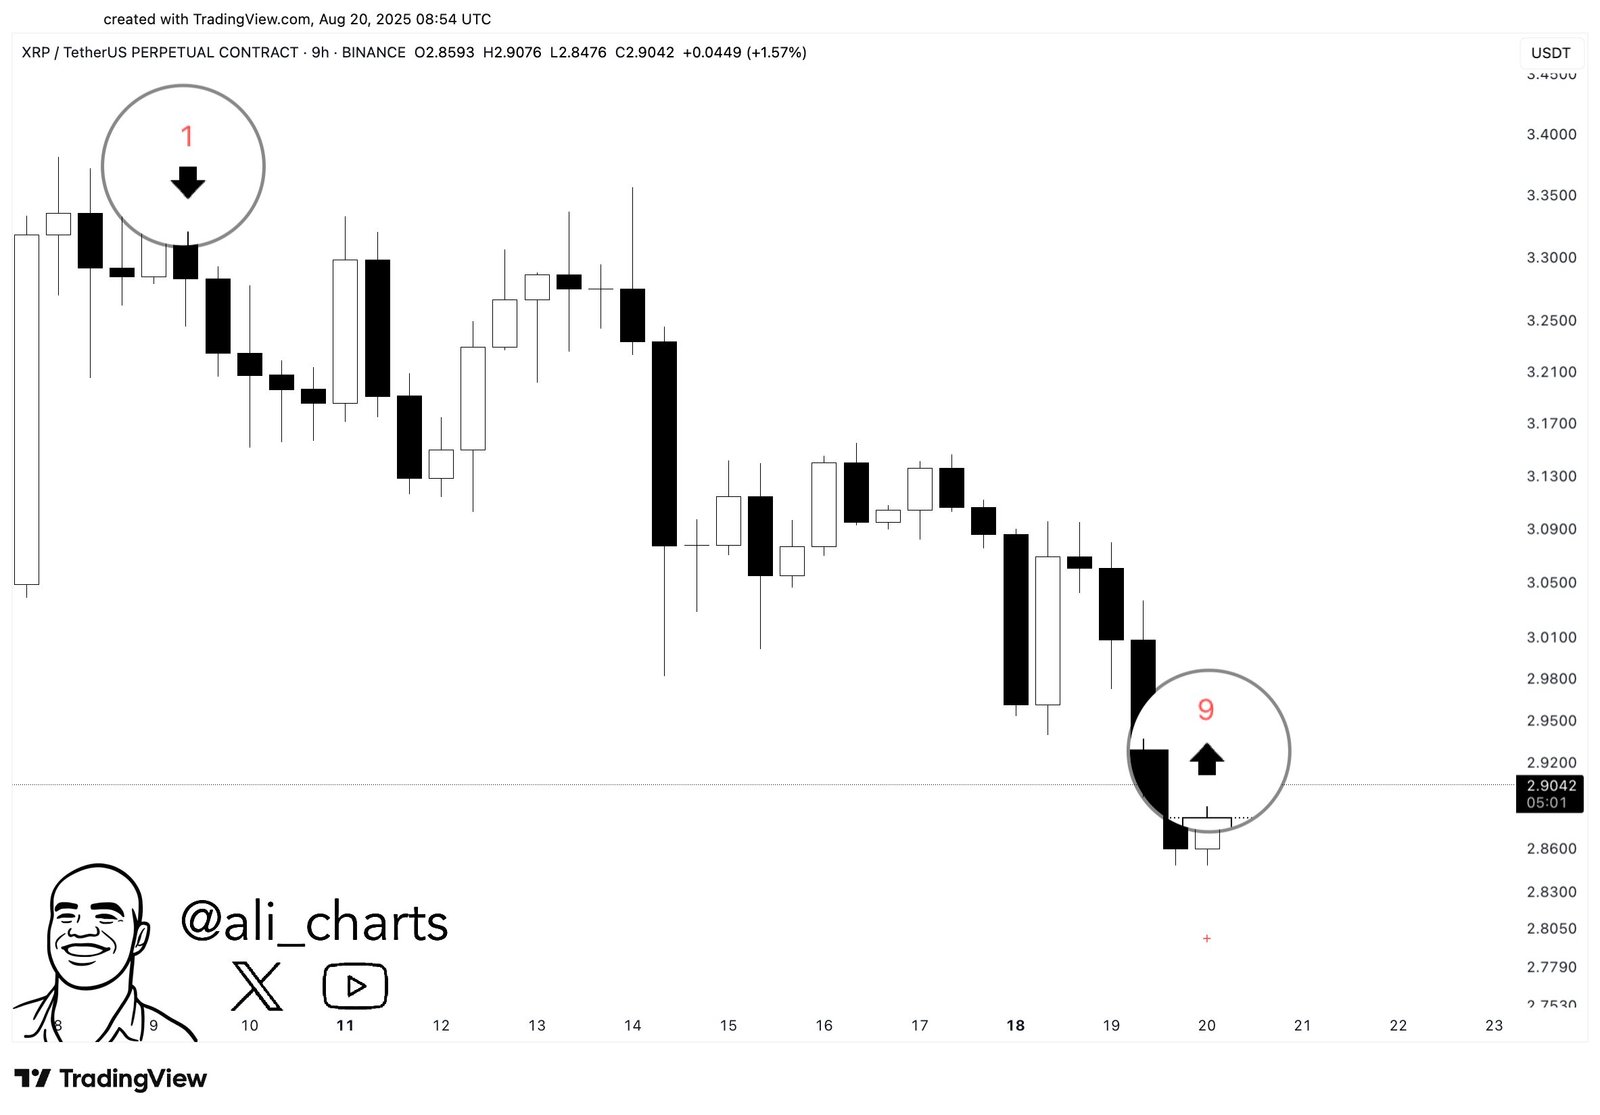
XRP traded between $2.84 and $2.90 at the time of the signal. The chart highlights how earlier setups from the same tool aligned with local reversals. For instance, the bearish setup at “1” near $3.40 preceded a strong decline. Now, the bullish “9” suggests the market may prepare for a rebound.
The latest setup arrives after XRP lost nearly 15 percent since mid-August. The candle structure shows declining momentum, which often increases the chance of corrective moves upward. While the signal does not guarantee sustained rallies, it reflects a potential short-term relief phase for XRP holders.
XRP Whales Sell 470 Million Tokens in 10 Days
Large XRP holders unloaded about 470 million tokens in the past ten days, according to data shared by market analyst Ali (@ali_charts). The activity comes as XRP struggles to hold support levels near $2.90.
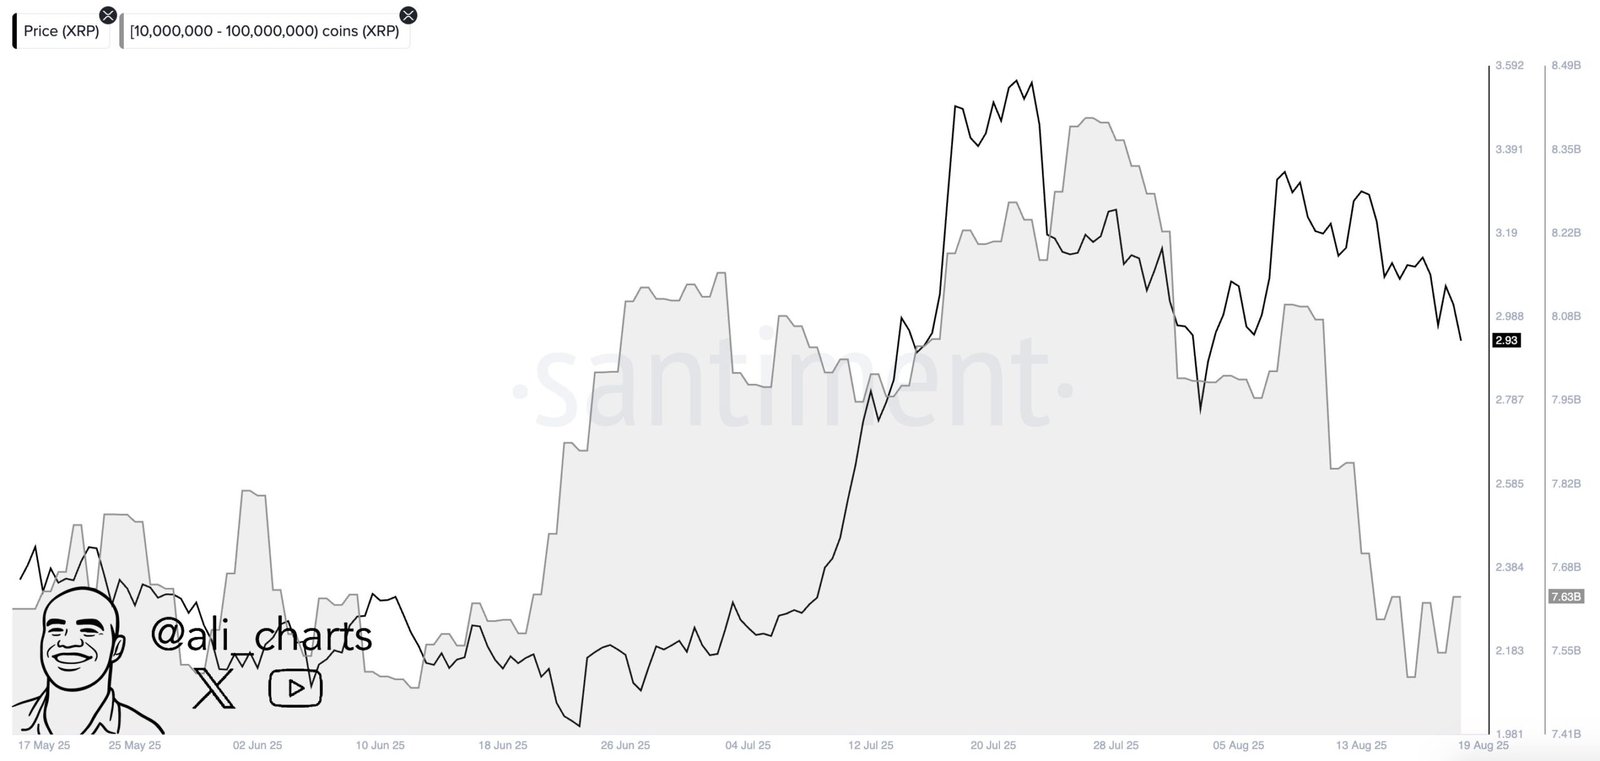
The chart, sourced from Santiment, shows holdings of addresses with 10 million to 100 million XRP coins. In early August, these wallets collectively controlled more than 8.3 billion tokens. However, the balance dropped to around 7.63 billion by August 19, marking a sharp reduction.
XRP’s price trended downward in parallel with the whale selling pressure. The token traded close to $2.93 at the latest reading, after retreating from highs above $3.50 earlier in the month. Historically, sustained whale offloading has aligned with local corrections in XRP markets.
The recent sell-off highlights ongoing volatility in XRP despite brief recovery signals from technical indicators. While the TD Sequential flashed a buy setup earlier on August 20, whale activity shows that selling pressure from major holders continues to weigh on market sentiment.
XRP Forms Falling Wedge Pattern With 77% Upside Potential
On August 20, 2025, XRP/USD daily chart revealed a falling wedge formation, a technical pattern that often signals a potential bullish reversal after a period of consolidation. A falling wedge occurs when the price contracts between two downward-sloping lines, with the lower slope being steeper than the upper one, indicating weakening bearish momentum and the likelihood of an upside breakout.

At press time, XRP traded at $2.90, hovering around its 50-day exponential moving average of $2.94. The chart illustrates how XRP has been compressing within the wedge structure since early August, with decreasing volatility as the price tested both upper and lower boundaries. This contraction suggests that selling pressure has slowed, and momentum is shifting toward a possible breakout.
The projection from this setup points to a potential 77 percent surge from current levels. If confirmed, XRP could rally toward $5.17, the target derived from the measured move of the wedge pattern. Such a move would align with the breakout direction indicated by the upward arrow on the chart, suggesting strong follow-through if buying pressure accelerates.
Volume data supports this possibility, as periods of reduced activity have often preceded sharp expansions in XRP trading. Furthermore, the broader context shows that XRP previously experienced a similar consolidation before a steep rally in July, reinforcing the validity of the wedge setup.
If buyers sustain momentum above the wedge resistance, XRP’s technical structure confirms the possibility of reaching the projected $5.17 level, marking a significant recovery from recent lows. This makes the falling wedge pattern a key development for traders monitoring XRP’s next decisive move.
XRP MACD Analysis Points to Bearish Momentum
On August 20, 2025, XRP’s daily Moving Average Convergence Divergence (MACD) indicator signaled continued weakness after the latest correction. The MACD, which tracks momentum by comparing short-term and long-term exponential moving averages, showed its blue line (MACD line) crossing below the orange line (signal line). This crossover suggests that selling momentum dominates the market.

The histogram bars, which measure the difference between the MACD line and the signal line, have extended deeper into negative territory. This confirms growing bearish pressure, as the red bars indicate sellers gaining control. The current reading stands at approximately -0.043, reflecting stronger downside momentum compared to earlier in August.
Despite this weakness, the chart shows how previous negative swings in the MACD often preceded periods of recovery once momentum reached exhaustion. For instance, similar crossovers in February and June initially drove prices lower but eventually set the stage for rebounds as selling power faded.
At present, XRP must reclaim the signal line and shift histogram bars back into green territory to confirm a recovery phase. Until then, the MACD structure indicates that bearish sentiment continues to weigh on price action, with momentum tilted against buyers in the short term.
XRP RSI Analysis Suggests Weak Momentum
On August 20, 2025, XRP’s daily Relative Strength Index (RSI) showed a reading of 42.69, which placed it below the neutral 50 line and indicated bearish momentum. The RSI, which measures the speed and magnitude of price movements on a scale from 0 to 100, is often used to identify overbought or oversold conditions.
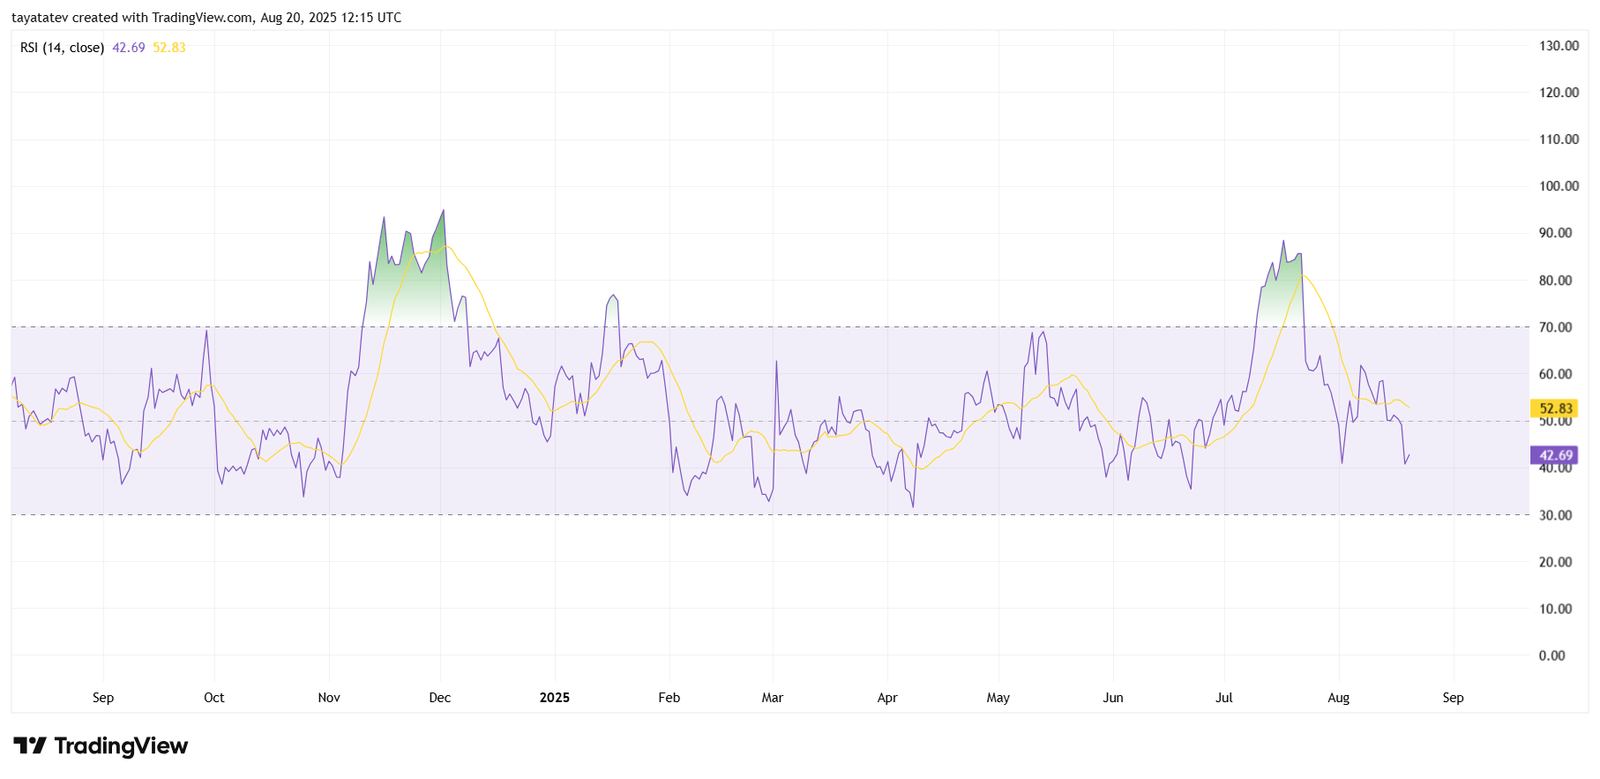
Currently, XRP is not yet in the oversold territory, which begins below 30. Instead, it rests in the lower range of the neutral zone, reflecting subdued buying interest and stronger selling pressure. This positioning signals that while the market is not deeply oversold, it lacks enough momentum to trigger a strong reversal.
The RSI trend also shows a steady decline from levels above 70 in late July, where XRP entered the overbought zone. That period coincided with sharp rallies but was followed by corrective moves as profit-taking increased. Now, the drop toward the 40–45 band suggests the market continues to consolidate under bearish influence.
For a stronger recovery signal, XRP’s RSI would need to cross back above the 50 level with sustained momentum. Until that occurs, the indicator points to limited bullish strength, leaving the token vulnerable to continued sideways or downward pressure.
