
Key Takeaways:
- Bitcoin price rallied crosses $30,000 on Oct. 20 as the market trend turned bullish.
- BTC price en route to painting best weekly gains since June 2023.
- The token has formed a bullish technical pattern.

NEW DELHI (CoinChapter.com) — Bitcoin (BTC) price roared past $30,000 on Oct. 20 before paring some of its gains. Meanwhile, some bullish cues surfaced.
One of the clearer cues came from the US Securities and Exchange Commission (SEC) waving the white flag in its legal battle against Ripple. Market participants welcomed the news, with nearly all crypto token prices registering gains.
The regulatory body dropped its charges against Ripple Labs CEO Brad Garlinghouse and Executive Chairman Chris Larsen, marking another victory for the blockchain firm.
However, it was not the only cue pumping BTC price action. On Oct. 19, Federal Reserve Chair Jerome Powell signaled that the central bank might suspend interest rate hikes “so long as recent progress on inflation continues.”
The Fed chair’s comments mirrored those of his colleagues, who had hinted at holding the rates constant at the next FOMC meeting. Powell’s speech might have also considered the swift rise in long-term interest rates in September.

A pause in interest rate hikes would likely invite investors to risk assets like Bitcoin. Furthermore, though Powell did not specifically declare a pause in rate hikes, market participants interpreted the Fed chair’s speech as dovish.
Spot BTC Approval Rumors
Additionally, speculations of the SEC approving a Bitcoin spot ETF surged following the news of Ripple’s win. Google’s search analytics predicted the “interest over time” for phrases related to Bitcoin spot ETF would likely spike shortly, indicating interest among users.
Speculation of a spot ETF approval also gained traction after the SEC decided not to appeal the negative ruling in its lawsuit against Grayscale. The court had scolded the regulator for the grounds for rejecting Grayscale’s application.

Investment firm Blackrock filed an updated BTC spot ETF application on Oct. 20. financial services firm JP Morgan also stated that it expects the SECtoy to approve a Bitcoin spot ETF “within months.”
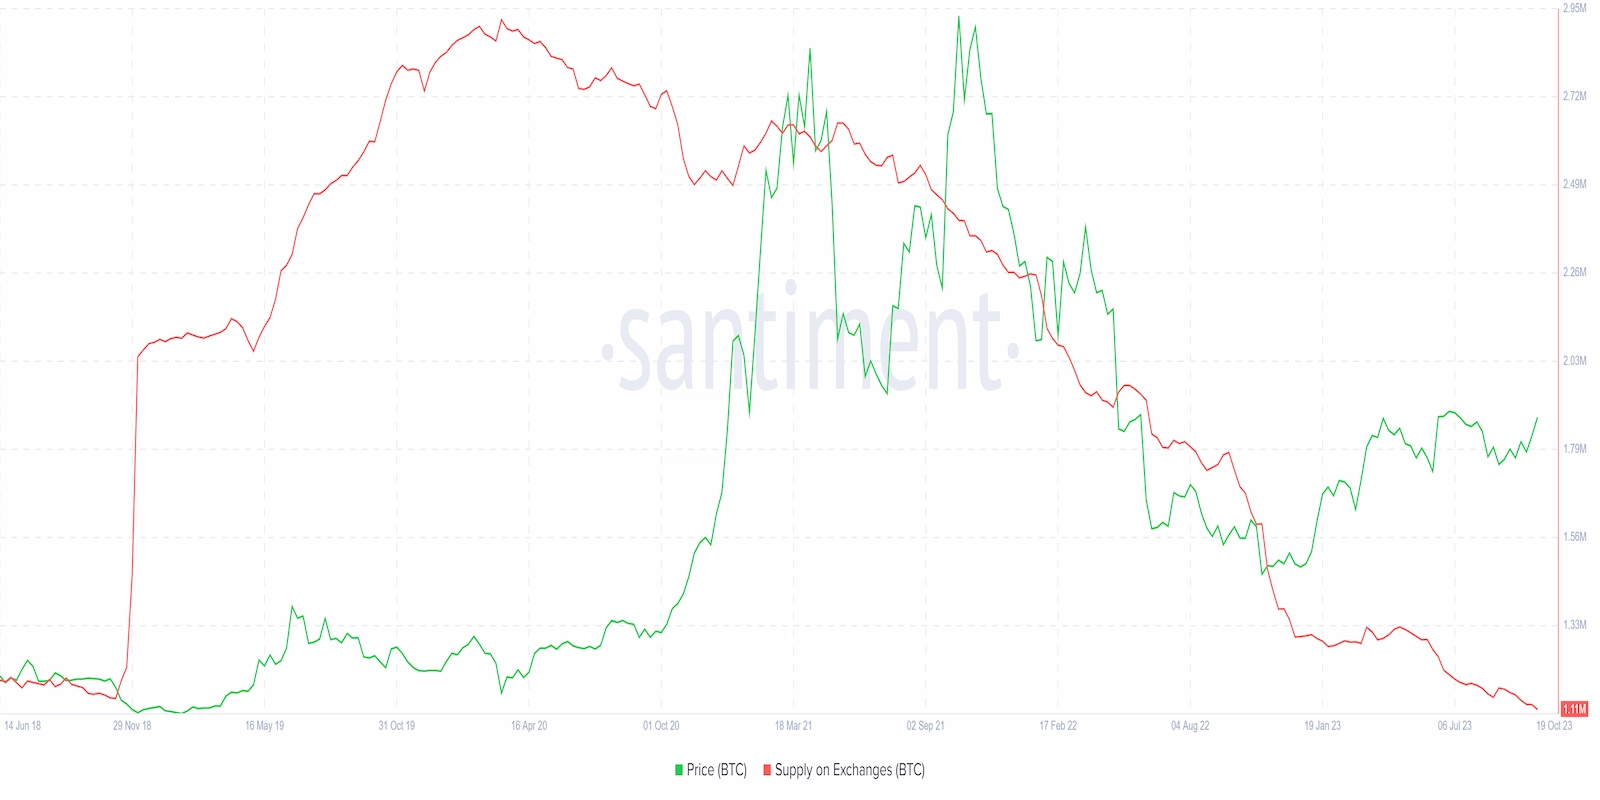
Supply On Exchanges Dives While BTC Shorts Liquidate
Meanwhile, BTC supply on exchanges has dropped since November 2018. The drop in supply on exchanges indicates a hodling mentality among investors, suggesting that market participants are speculating on a bullish future for BTC price action.
BTC perpetual contracts funding rate, which became negative on Oct. 19 after dropping 570% in 24 hours to reach -0.0047% every eight hours, painted a sharp recovery on Oct. 20. The open-interest weighted funding rate spiked over 133% in 8 hours to reach $0.0017% every eight hours at 13:30 hrs (IST).
Data from Coinglass shows that BTC short positions saw liquidations worth $38.5 million since Oct. 19, in comparison to the roughly $11 million worth of liquidations for the longs.
As the rally continues, more short positions face the risk of liquidation, which would cause traders to panic buy BTC tokens, spiking demand and, consequently, the token’s price.
Bitcoin Price Above $30,000
The bullish cues came together to push Bitcoin price above $30,000 for the first time since Aug. 9 earlier this year. However, bears started booking profits, resulting in BTC prices undergoing a minor correction.

Bulls will likely try to push Bitcoin above the resistance near $30,400 to establish control and infuse confidence in the rally. A close above the immediate resistance might help the BTC price rally to the resistance near $31,860 before corrections pare gains.
As such, traders could open long positions near $31,800 after a confirmed break above the immediate resistance.
However, the RSI for BTC became overbought, scoring 74.01 on the daily charts. Traders generally view the occurrence as a bearish signal, which could prompt increased selling, pushing the BTC price to support near $28,500.
A breakdown below the immediate support might force bulls to defend the 200-day EMA (the green wave) support near $27,000.
Bitcoin Price Forms A Bullish Technical Pattern
Bitcoin price is moving inside a bullish technical pattern called the “Ascending Triangle.”

The technical pattern forms due to price moves that allow a horizontal trendline to connect the swing highs and a rising trendline to connect the swing lows. The price target for the pattern is equal to the triangltriangle’s at its widest part.
Thus, if the triangle pattern pans out, the BTC price could rally over 55% to reach the pattern’s theoretical price target near $45,500.

… [Trackback]
[…] Find More to that Topic: coinchapter.com/yeyyy-bitcoin-price-heads-to-30k/ […]
… [Trackback]
[…] Read More on to that Topic: coinchapter.com/yeyyy-bitcoin-price-heads-to-30k/ […]
… [Trackback]
[…] Info on that Topic: coinchapter.com/yeyyy-bitcoin-price-heads-to-30k/ […]