
Zebec Network’s ZBCN defended its rising 4-hour trendline overnight while price continued to coil inside a symmetrical triangle. The chart timestamp shows Sep 22, 2025. Trading clustered near the 0.236 Fibonacci retracement around 0.003455, keeping consolidation intact into Monday.

Meanwhile, the red converging lines mark lower highs since late June against higher lows since early July, pointing to an apex in early October. Buyers held the ascending base through the night; however, the range remains unbroken and direction awaits a clear resolution.
Furthermore, immediate resistance sits at 0.00448–0.00452 and then 0.004725 (0.5), followed by 0.00529 (0.618), 0.00600 (0.786), and the prior swing near 0.00713. On the downside, intraday support appears near 0.00370, with additional shelves around 0.00321–0.00320 and a deeper base near 0.00240–0.00232.
Finally, reported 24-hour volume hovers near 5 percent, which lands inside the “strong” 2–10 percent bracket noted by the trader. Even so, activity has not forced a breakout, and price continues to test the mid-range levels inside the pattern.
ZBCN momentum cools as RSI stays below midline
ZBCN’s 14-period RSI reads 40.85 at Sep 22, 2025, 13:27 UTC, while the signal sits at 48.48, keeping momentum below 50 and under its signal. That placement conveys near-term seller control without oversold stress, since the gauge holds above 30. The latest dip also extends a sequence of lower RSI highs since June, which confirms weakening follow-through on rallies.
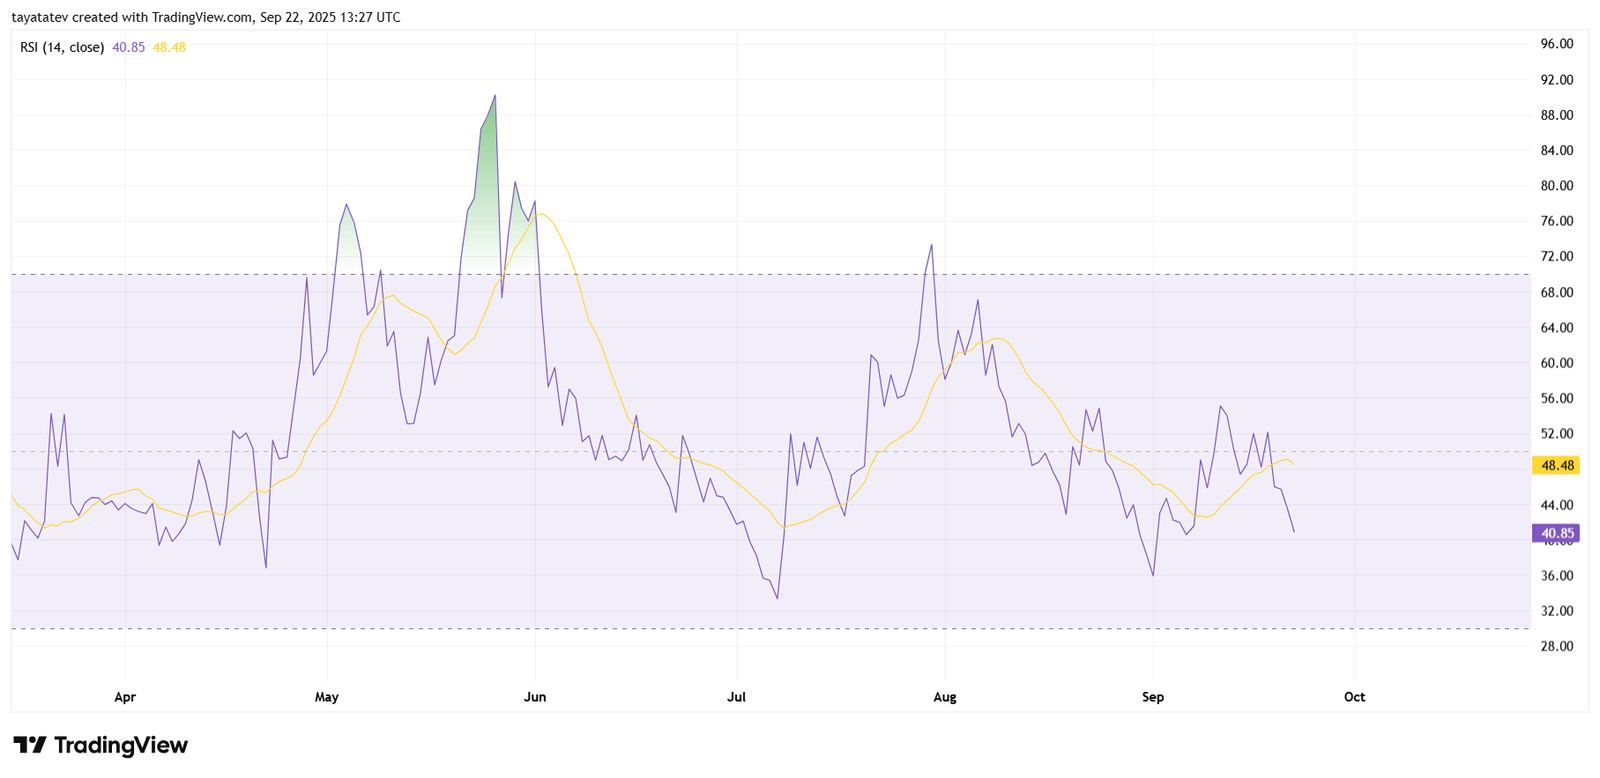
However, context matters. The oscillator briefly pressed into the low-50s earlier this month, then rolled back under the signal, showing that buyers attempted to turn the tide but lacked breadth. As a result, momentum now tracks the lower half of the band, where tests of 40–38 often decide whether pressure accelerates or stabilizes. A firm reclaim of 50—and a cross back above the signal—would mark a clean shift toward neutral-to-positive impulse and typically accompanies stronger candles.
This momentum read also aligns with the price setup you shared earlier. The triangle on the 4-hour chart tightened, and RSI sitting sub-50 reflects that indecision leaning mildly bearish. If RSI pushes through 55–60, it would usually validate an upside break from the range. Conversely, persistent prints near 40 or a slide toward 35–33 would match a downside probe of support inside the pattern. Watch for a bullish divergence if price retests support while RSI forms a higher low; that configuration often precedes stabilization. Until one of those signals appears, the oscillator argues for patience: momentum is cool, directional conviction is limited, and confirmation still hinges on an RSI regain of the midline.
ZBCN MACD tilts negative as momentum stalls
ZBCN’s MACD (12,26, close) reads -0.0000932 against a -0.0000690 signal at Sep 22, 2025, leaving the histogram slightly negative at -0.0000242. The blue line sits below the orange signal and below the zero line, so near-term momentum leans bearish.
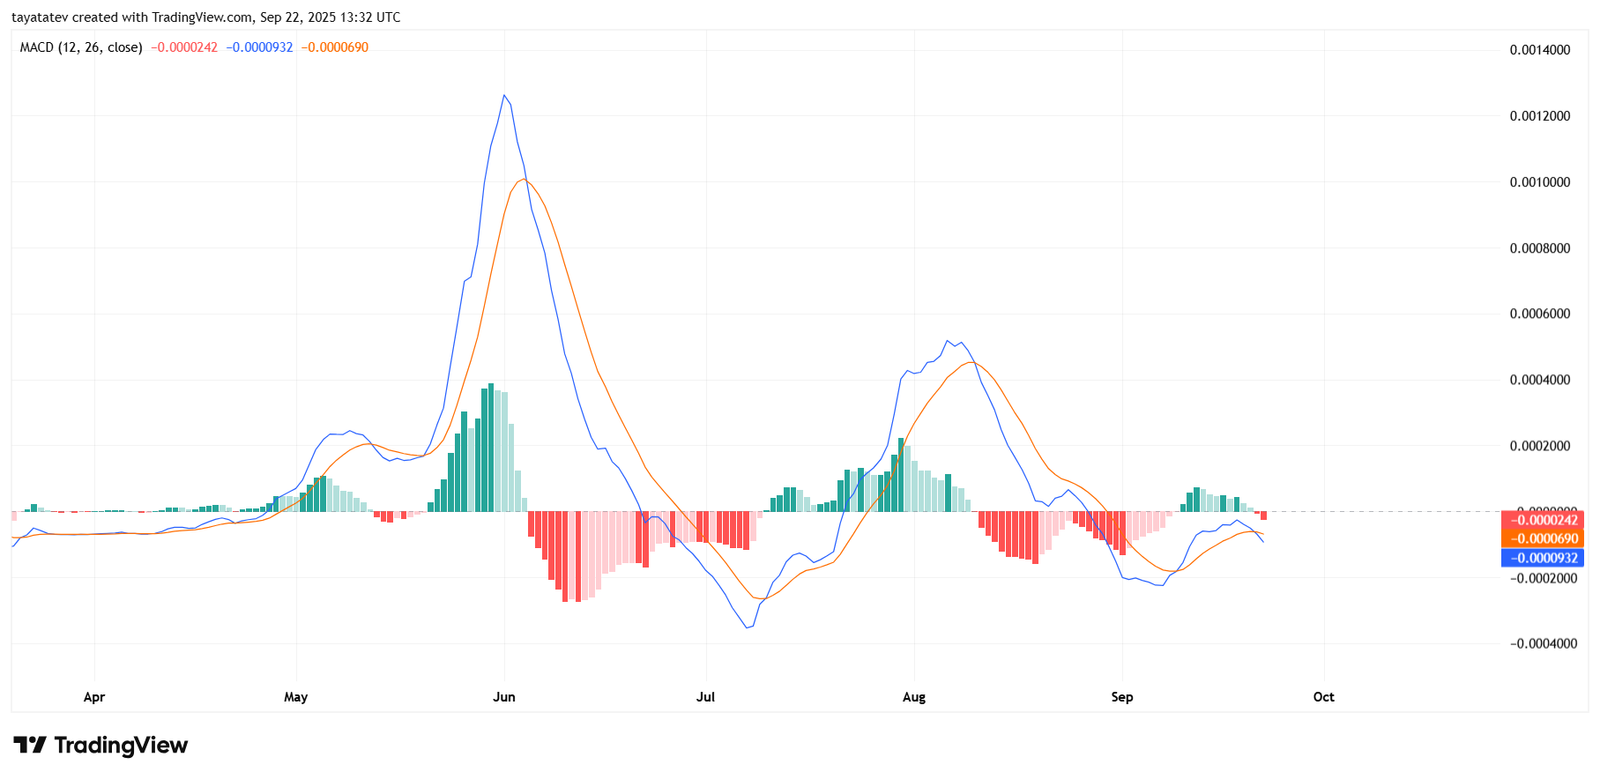
The pair crossed up from sub-zero earlier this month. It printed brief green bars. Then the move faded. The lines rolled over again. The histogram flipped back to red.
However, the downswing looks modest. It is smaller than June’s surge. It is also smaller than the early-August push. That scale signals consolidation, not acceleration.
From here, watch the signal line. A cross back above it with rising green bars would show rebuilding upside momentum. Yet deeper red bars below zero would confirm renewed downside pressure.
