
Key Takeaways:
- Holochain native token HOT’s Price continued its bull run on Oct. 16.
- HOT Price has formed a bullish technical pattern.
- The rally resulted in massive short liquidations.

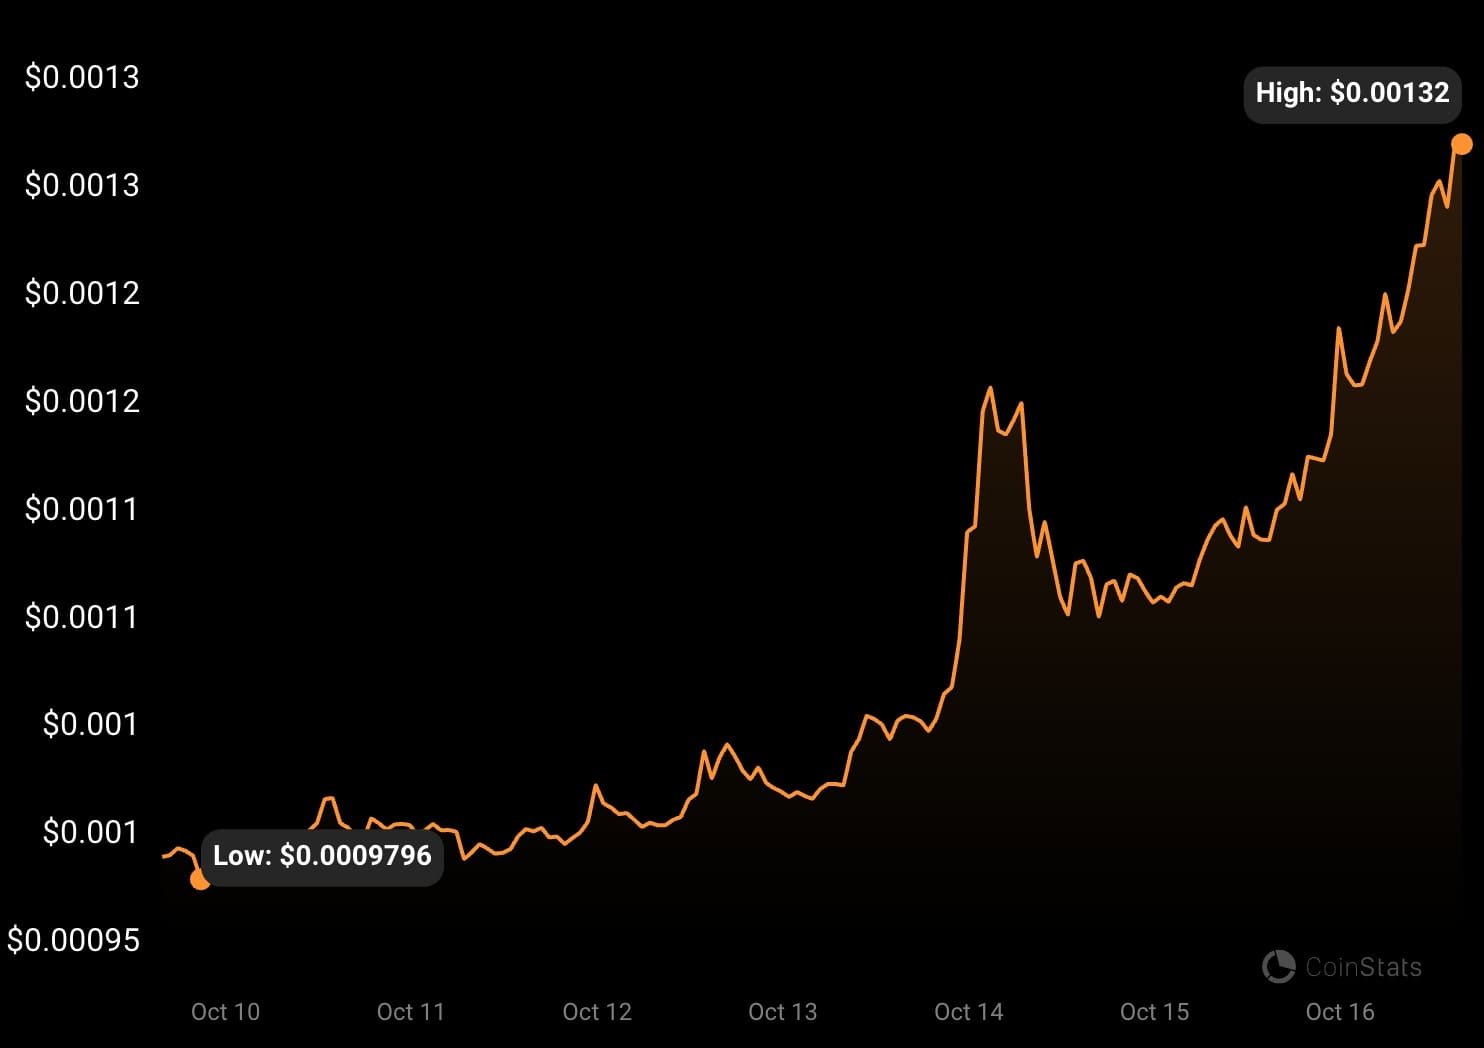
NEW DELHI (CoinChapter.com) — Holochain’s native token, HOT, continued its price rally on Oct. 16, spiking over 34% from Oct. 10’s low of $0.00099.
HOT prices spike on Oct. 13 resulted in nearly $292,000 worth of short liquidations, compared to nearly $104,200 in long liquidations. Afterward, HOT prices corrected on Oct. 14, leading traders to bet the rally was over.
As a result, the longs led the liquidations on Oct. 14. However, as the rally continued, short traders scrambled to cover their losses, likely helping increase the buying pressure in favor of the Holochain token.
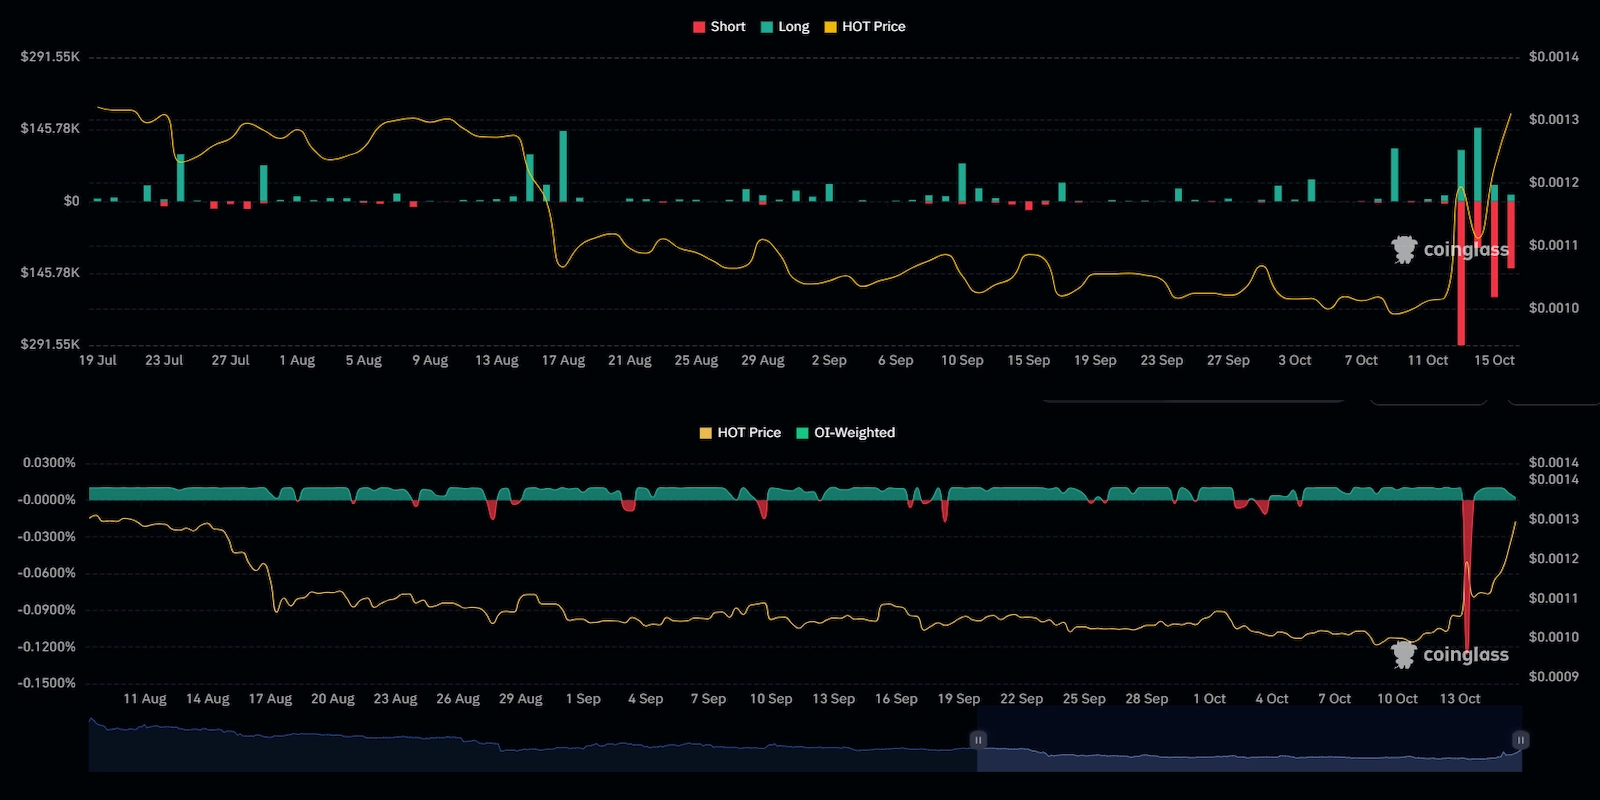
During the Holochain token’s bull run between Oct. 10 and 17, traders liquidated nearly $317,400 in long positions. In comparison, shorts saw liquidations of over $772,000 during the same period. So, short liquidation forced traders to buy tokens to cover their margins, boosting HOT prices.
On the other hand, the funding rate for the Holochain token and the open interest are declining, suggesting that traders are betting that the Holochain token’s rally might end soon.
HOT Price likely responded to news of Holochain wrapping up its developer training program. Participants of the program will now spend a month developing new projects for the Holochain ecosystem.
Profit Booking Could Halt HOT Price Rally
Meanwhile, the HOT coin price might be heading for a reversal due to traders beginning to book profits. Per on-chain data provider Santiment, HOT’s exchange inflow spiked on Oct. 16.
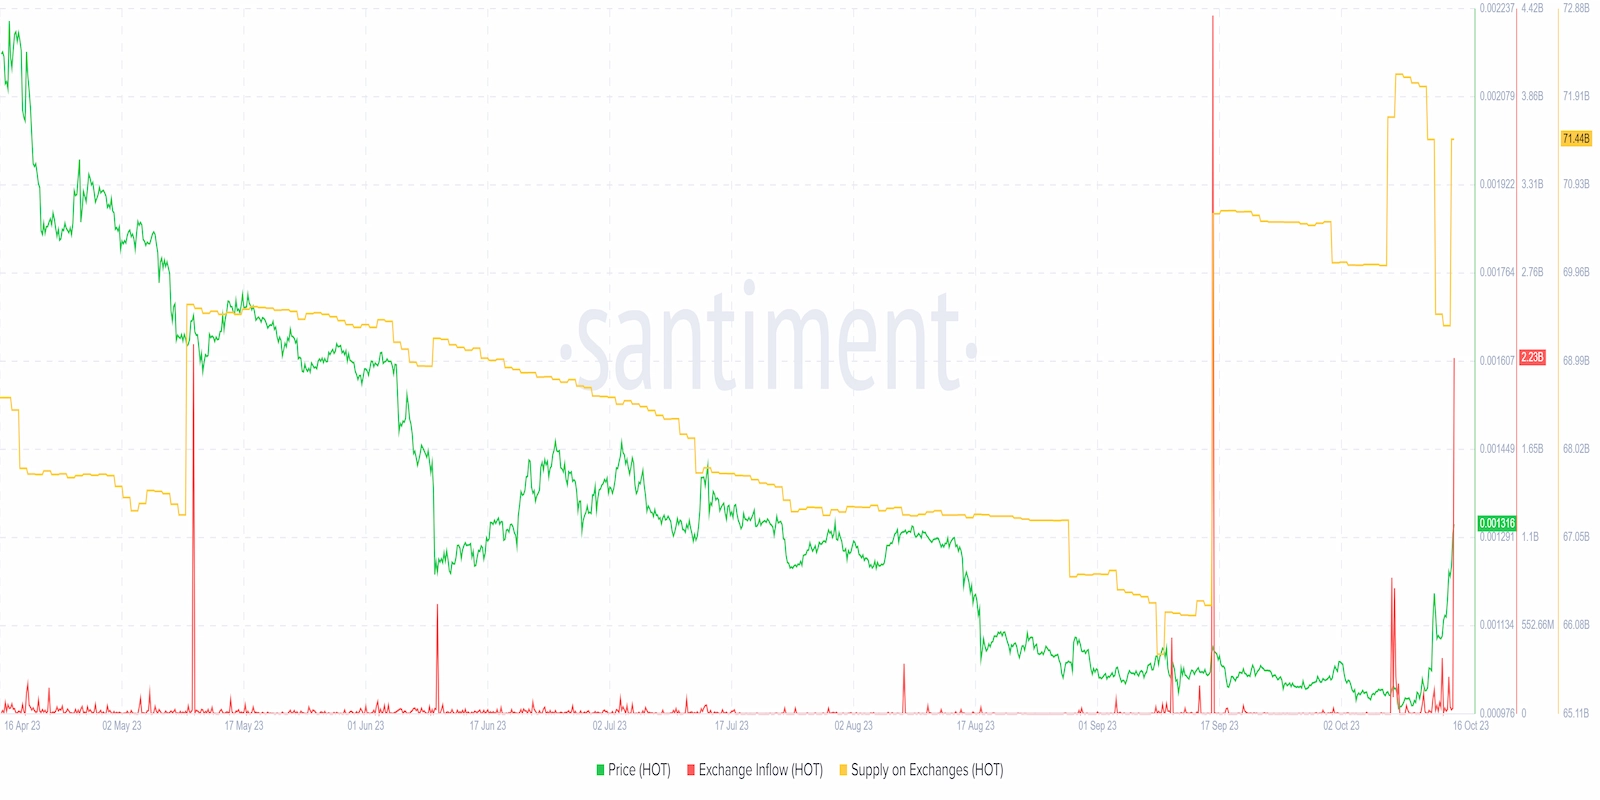
The Holochain token’s exchange inflows spiked to 2.23 billion tokens on Oct. 16, a significant jump from Oct. 15’s inflows of 226.9 million tokens. As a result, the token’s balance on exchanges also spiked.
Traditionally, an increase in an asset’s supply on exchanges indicates traders are setting up to book profits.
Furthermore, HOT Price’s relative strength index has become overbought, clocking a score of 73.62 on the daily charts. Overbought RSI levels often precede a correction or consolidation phase for a token. Hence, traders construe the occurrence as a sell signal.
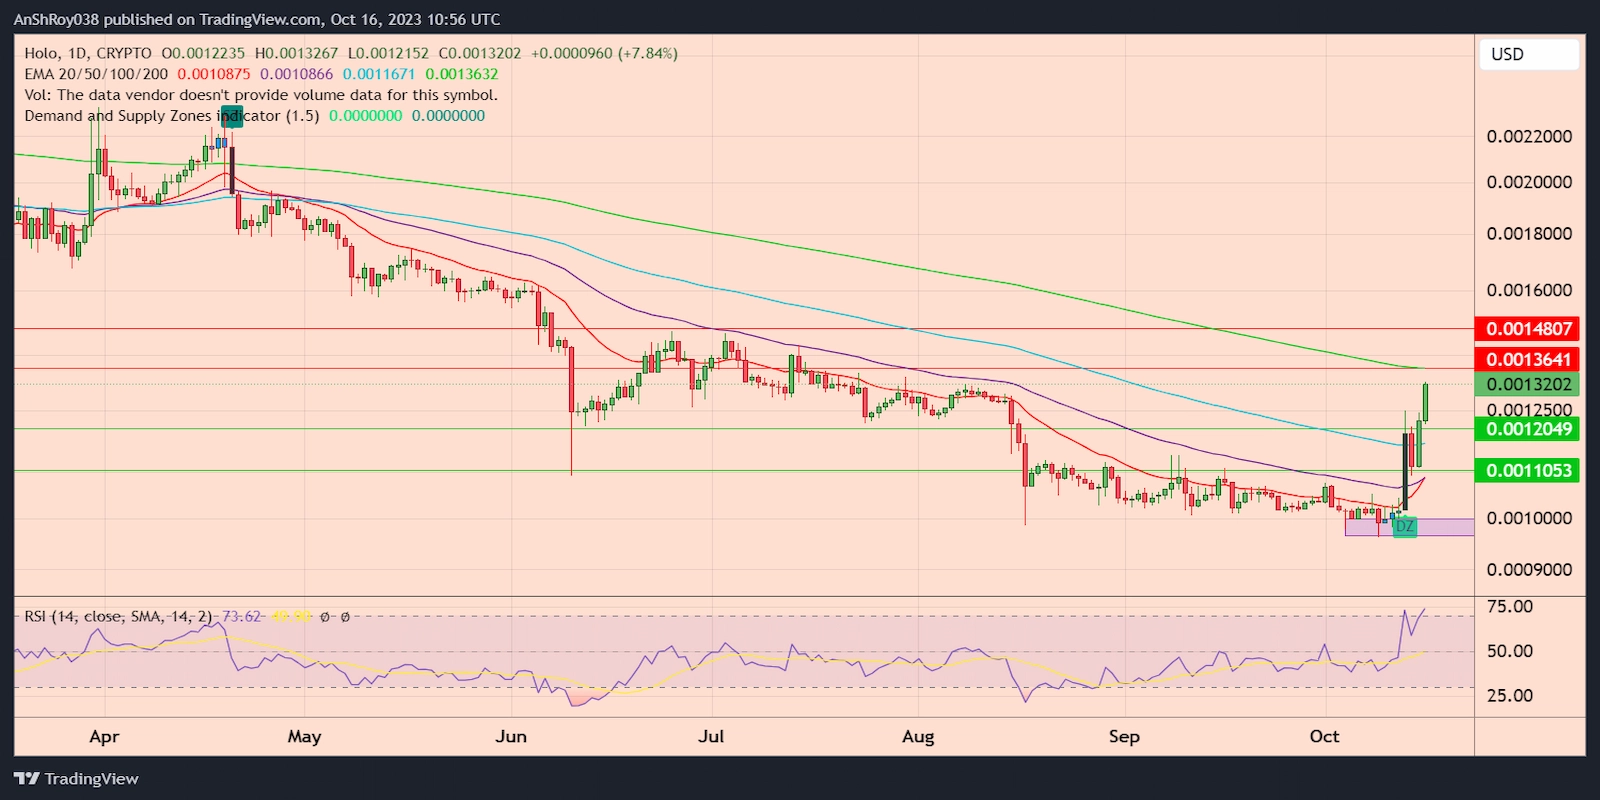
As such, the HOT Price could drop to the support near $0.0012. Moreover, breaching the immediate support could force the Holochain token price to test the support near $0.0011 before recovering.
Though HOT has some bearish cues lined up, the golden cross forming between the token’s 20-day EMA (red wave) and 50-day EMA (purple wave) could attract buyers to the market. Traders often view the pattern as an indicator of positive market sentiment.
Hence, the crypto token’s price might break above the 200-day EMA (green wave) resistance near $0.00136. Flipping the immediate resistance could help HOT price target the resistance near $0.00148 before retreating.
HOT Price rallied nearly 10% to reach a daily high near $0.00133 on Oct. 16 before paring gains, suggesting bears are selling near the 200-day EMA resistance level.
HOT Price Moving Inside Bullish Pattern
The Holochain token price has formed a bullish technical pattern called the ‘Falling Wedge.‘
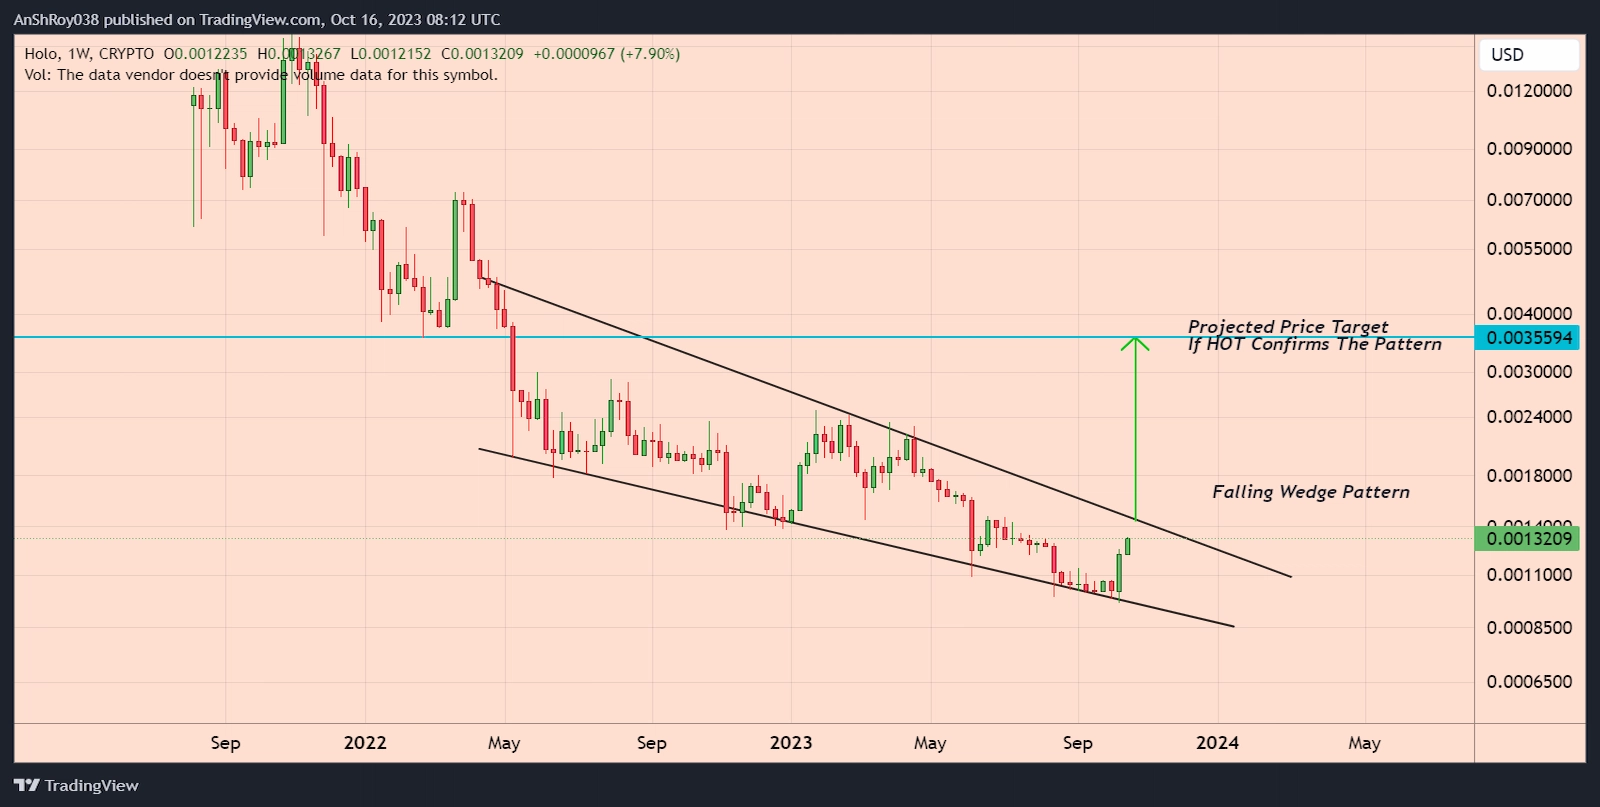
The technical pattern occurs when the Price fluctuates within converging falling trendlines, usually leading to an upward price breakout. The target for the breakout is the maximum distance between the wedge’s upper and lower trendlines.
Hence, the theoretical price target for HOT is near $0.00356, a spike of 170% from current price levels.

… [Trackback]
[…] There you can find 48668 additional Information to that Topic: coinchapter.com/whats-pumping-holochain-hot-token-price/ […]
… [Trackback]
[…] Read More to that Topic: coinchapter.com/whats-pumping-holochain-hot-token-price/ […]
… [Trackback]
[…] Information on that Topic: coinchapter.com/whats-pumping-holochain-hot-token-price/ […]
… [Trackback]
[…] Read More to that Topic: coinchapter.com/whats-pumping-holochain-hot-token-price/ […]