Key Takeaways:
- SEC filings reveal Goldman Sachs has been offering crypto exposure to clients via Galaxy Digital’s Ethereum Fund.
- Meanwhile, ETH prices jumped over 11% since Mar 8.
NEW DELHI (CoinChapter.com) — Ethereum’s native token, Ether (ETH), seems to be enjoying an increase in institutional interest.
Galaxy Digital’s latest filing with the U.S. Securities and Exchange Commission showed Goldman Sachs offered its clients exposure to Ether through Galaxy Digital’s Ethereum Fund. Goldman Sachs, a financial services giant, received introduction fees for referring clients to the fund.
However, the filing didn’t clarify how much Goldman’s clients invested, though the minimum investment per investor was $250,000. In addition, Galaxy’s ETH fund has had total sales of over $50.5 million.
Galaxy Digital also listed CAIS Capital, an independent wealth management firm, in its filing as a recipient of fees for referring its clients to Galaxy’s ETH fund. The filing shows increasing interest in Ethereum from investors seeking exposure to cryptocurrencies.
Coinshares weekly report on digital asset fund flows showed digital asset investment products saw a total inflow of $127 million in the week ending Mar 7.

Ethereum investment products saw nearly $25 million in inflows, its largest in 13 weeks. Furthermore, the current week’s inflow follows a stretch of mixed to negative sentiment prevalent since Dec.
Also Read: Ethereum fractal from 2017 suggests ETH would hit $17K this year.Meanwhile, Twitter-based analyst Cactus shared a post that indicated Ether reaching nearly $10,000 by the end of 2022.
The analyst based his prediction on Ether’s historical price action. As such, Cactus believes ETH’s recent price action could lead to a target around the Ethereum token’s 2.618 Fibonacci level.
Ether Price Charts
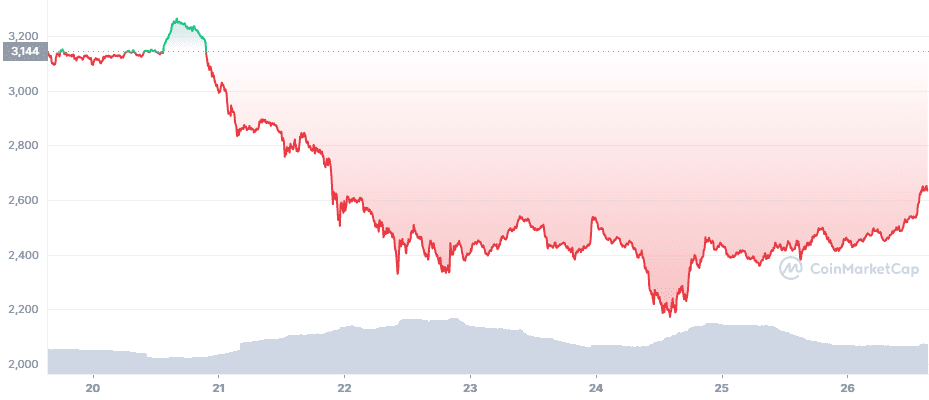
The Ethereum token’s prices have been trending downwards over the last seven days. ETH prices fell 17% between Mar 3’s high of $2,970 and Mar 7’s low of $2,446. However, Ether prices have been on an uptrend since Tuesday.
Since Mar 8, the token jumped nearly 12% to challenge a 3-month long descending trendline resistance. ETH has tried to breach above the trendline resistance at least five times, but the trendline rebuffed each attempt since Dec.
If the Ethereum token fails to move above the trendline resistance, ETH could fall to support near $2,600. Moreover, if bears look to profit from Ether’s recent uptrend, the resulting sell-off could push prices down to support near $2,500.
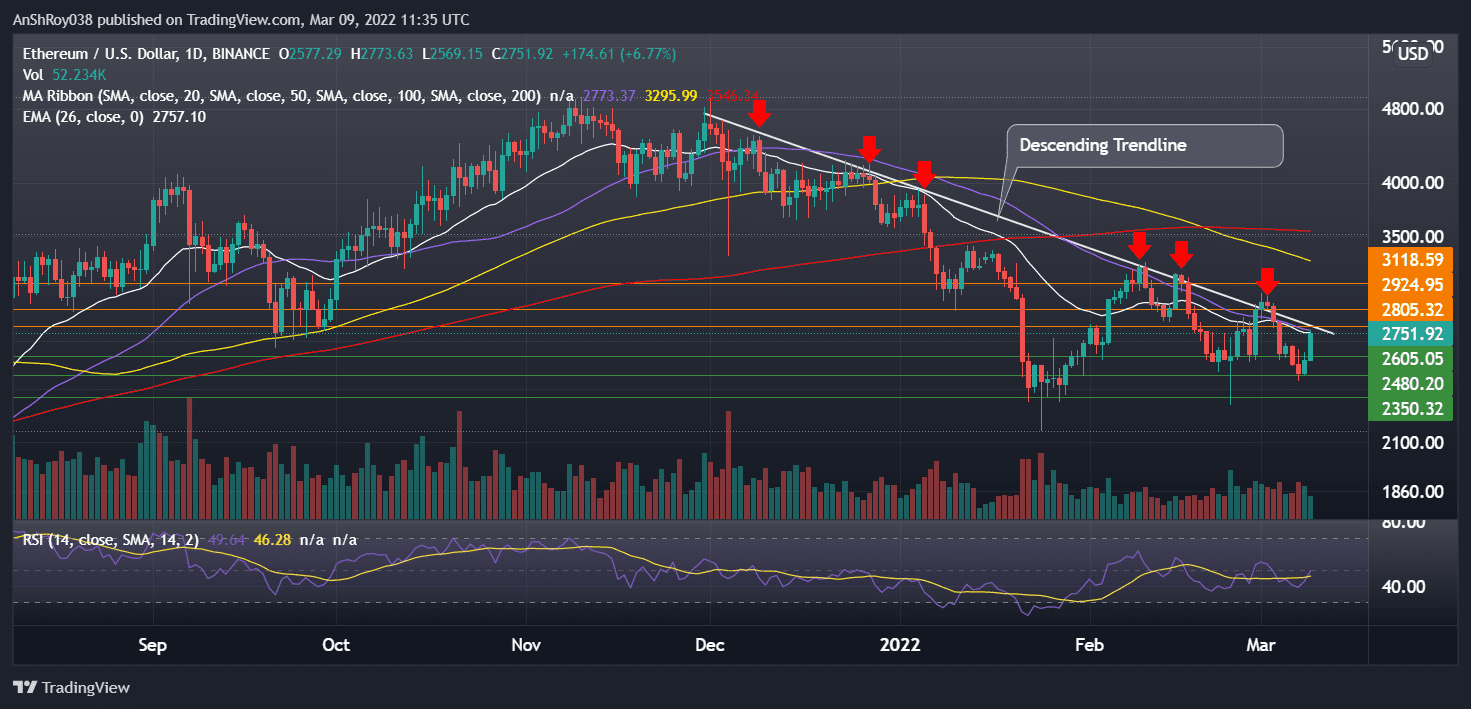
Finally, Ether has support around $2,300, a price level last seen in early Aug 2021. The relative strength index continues to be neutral for ETH, clocking 49.64 on the daily charts.
Also Read: Ethereum (ETH) dump ahead? Veteran investor says yes.Conversely, if Ether flips immediate resistance at $2,800, the alpha altcoin would move above the descending trendline, inspiring confidence in investors. As such, bulls could pull prices up to challenge resistance at $2,900.
Moreover, a sustained uptrend could see ETH move to $3,100 before corrections pull prices back.
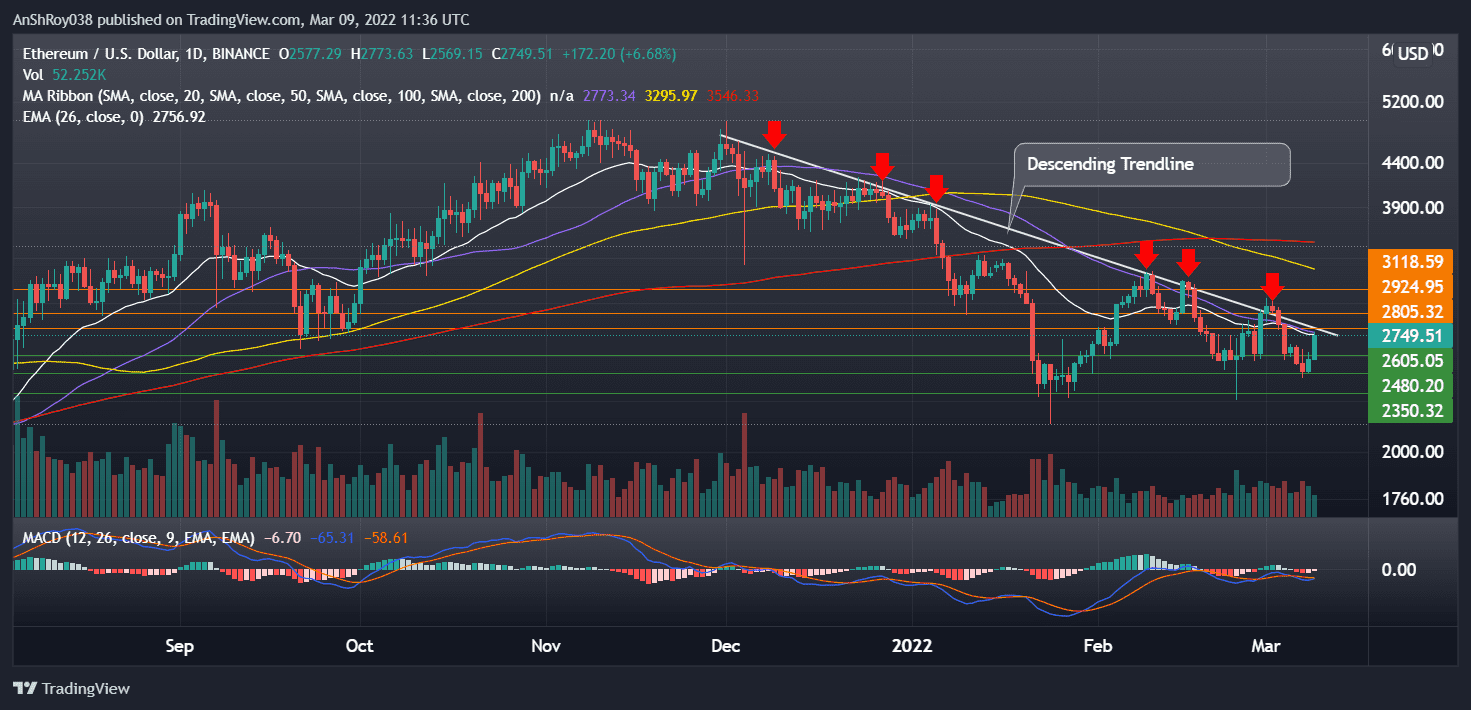
Meanwhile, momentum oscillator MACD is giving bullish signals for ETH. Negative bars on the MACD histogram are contracting, suggesting the MACD line (difference between 12-day and 26-day EMA) is moving up towards the MACD signal line (9-day EMA of MACD).
Once the MACD line crosses above its signal line, it indicates a bullish crossover, a technical pattern that traders view as a buy signal.
At the time of writing, ETH was trading at $2,742, up 6.4% on the day.

… [Trackback]
[…] Info to that Topic: coinchapter.com/ethereum-rallies-11-as-goldman-sachs-give-clients-access-to-new-eth-fund/ […]
… [Trackback]
[…] Read More Info here on that Topic: coinchapter.com/ethereum-rallies-11-as-goldman-sachs-give-clients-access-to-new-eth-fund/ […]
… [Trackback]
[…] Find More on to that Topic: coinchapter.com/ethereum-rallies-11-as-goldman-sachs-give-clients-access-to-new-eth-fund/ […]
… [Trackback]
[…] Read More to that Topic: coinchapter.com/ethereum-rallies-11-as-goldman-sachs-give-clients-access-to-new-eth-fund/ […]
… [Trackback]
[…] Read More on that Topic: coinchapter.com/ethereum-rallies-11-as-goldman-sachs-give-clients-access-to-new-eth-fund/ […]