Key Bitcoin Takeaways:
- The flagship cryptocurrency registered several metrics, that indicate a looming bearish market, following the recent decline.
- Rising Realized HODL bands paint a bearish picture.
- The declining MVRV Z-score, RPV Ratio, and the Puell Multiple support the outlook.
YEREVAN (CoinChapter.com) – Bitcoin (BTC), the largest cryptocurrency with a market cap of $810 billion, faced a turbulent two months after peaking at $69,000 on Nov 10. However, the Bitcoin bulls might have their work cut out, as several metrics point to a bearish continuation in 2022. An anonymous user on the analytical platform Glassnode pointed out four of them.
Most of the indicators described below base their calculations on metrics dubbed Market Value (Market Cap) and Realized Market Value (Realized Market Cap). However, before going into more detail, it is essential to differentiate the two.
Market Value (MV) reflects the current price of Bitcoin multiplied by the number of coins in circulation.
Realized Value (RV) does not consider the current BTC price. Instead, RV takes the price of each Bitcoin when it was last moved, i.e., the last time it was sent from one wallet to another wallet. The indicator then adds up all those individual prices and calculates their average.
That average price, not the current price, is then multiplied by the total number of coins in circulation.
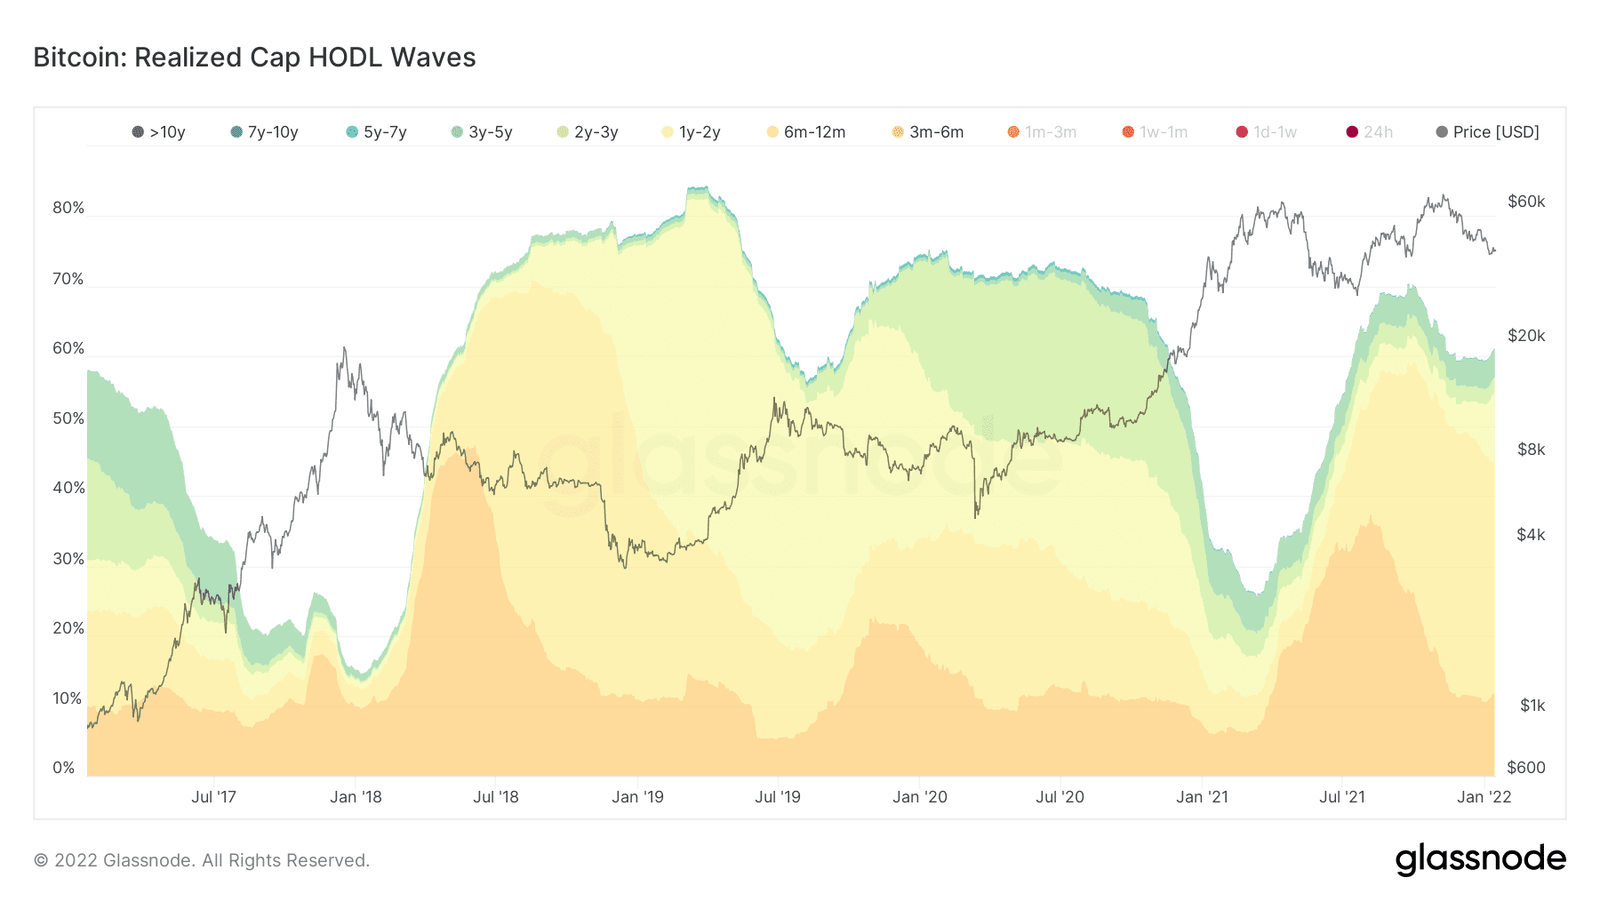
Rising Realized HODL Bands
RHODL ratio is a market indicator that takes the ratio between the one week and the 1-2 years Realized Market Cap HODL bands.
In plain English, it means that the RHODL bands show how overheated the market is. Thus, they are instrumental in timing market tops and bottoms through an inverse correlation. Rising RHODL bands show that the market is overheated, and traders could expect a cool-off.
Also read: Bitcoin gains institutional adoption in Brazil: Rio de Janeiro to invest 1% of reserves in crypto
The chart above shows that the RHODL bands started to pick up again in January 2022, suggesting a decline ahead.
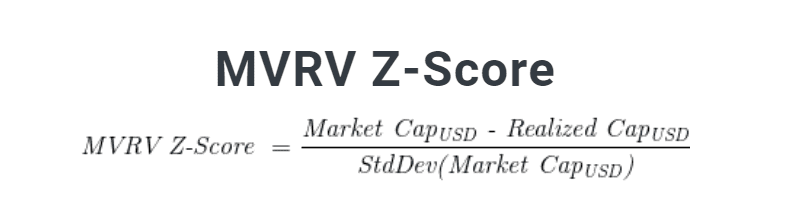
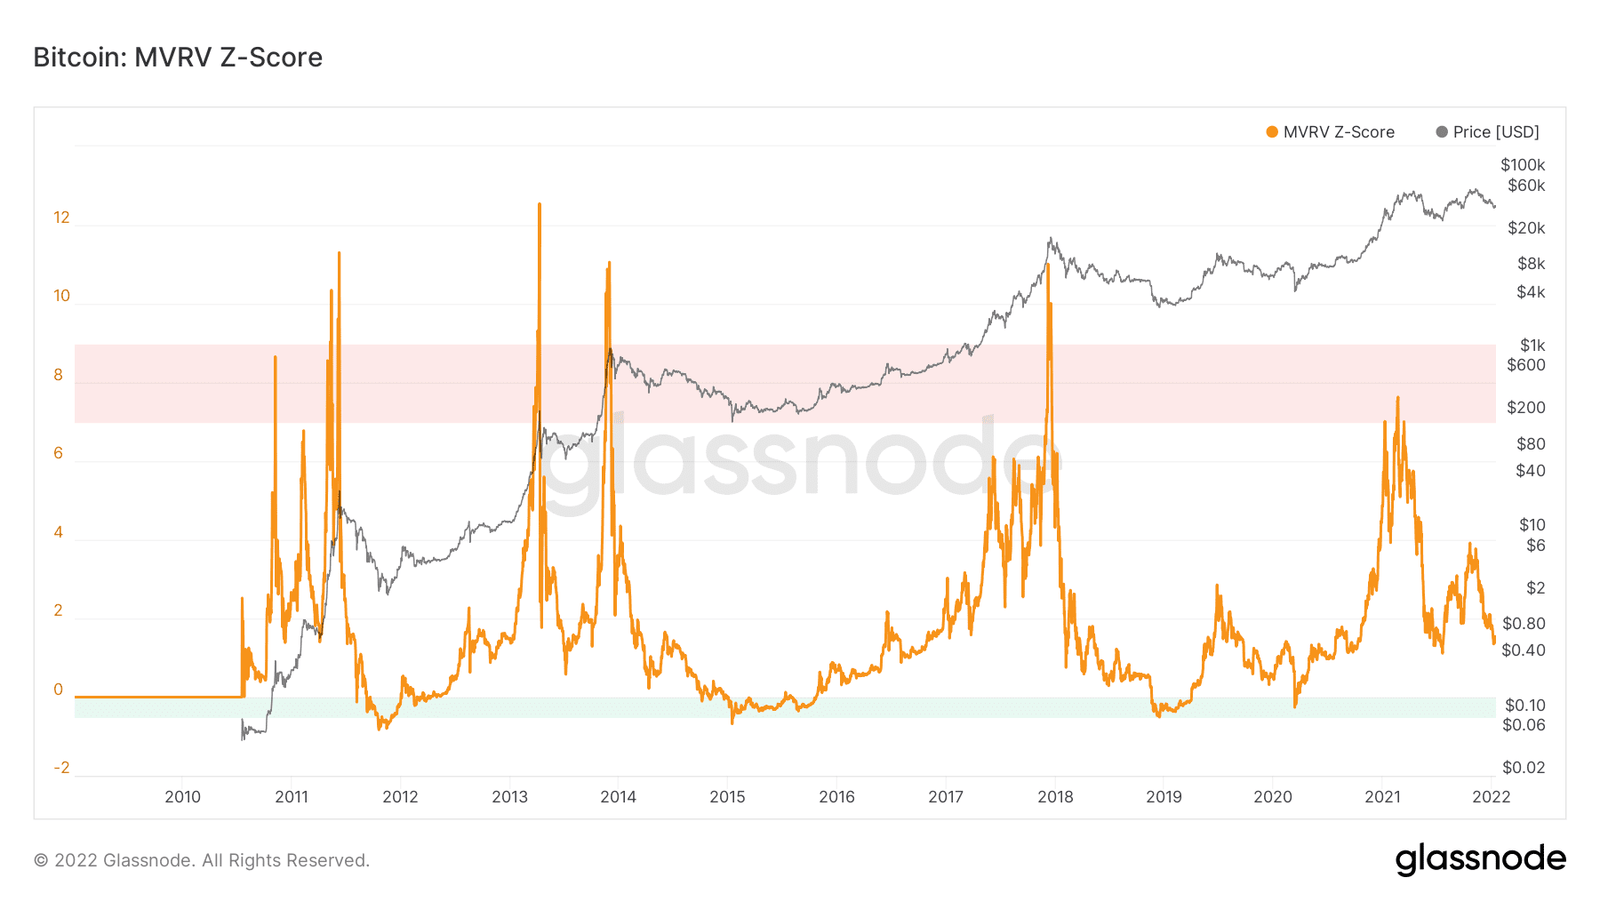
Declining Market Value/Realized Value (MVRV) Z-score
The MVRV Z-score is another metric that confirms the bearish outlook. Despite the confusing name, the metric is relatively straightforward. It compares Bitcoin’s current Market Value to its ‘fair’ value. The latter is calculated using standard deviation, which pulls out the extremes in the data between Market Value and Realized Value.
Practically, when the MVRV Z-score peaks, the price peaks along with the metric. A valley in the MVRV Z-score chart indicates a bearish market. The chart below shows the orange graph dropping low in 2022, which should be a red flag for traders.
Also read: Bitcoin docile at $42k as Cardano takes charge with 8% surge.
The next metric in favor of the bearish 2022 for Bitcoin is the Realized Profits-to-Value (RPV) Ratio.
Falling Realized Profits-to-Value (RPV) Ratio
In hindsight, a Realized Profit occurs when an investment is sold for a higher price than purchased. The RPV Ratio divides that profit by the Market Value. Thus, if the RVP is rising, the market should be bullish. The reverse is also true for the bearish market.
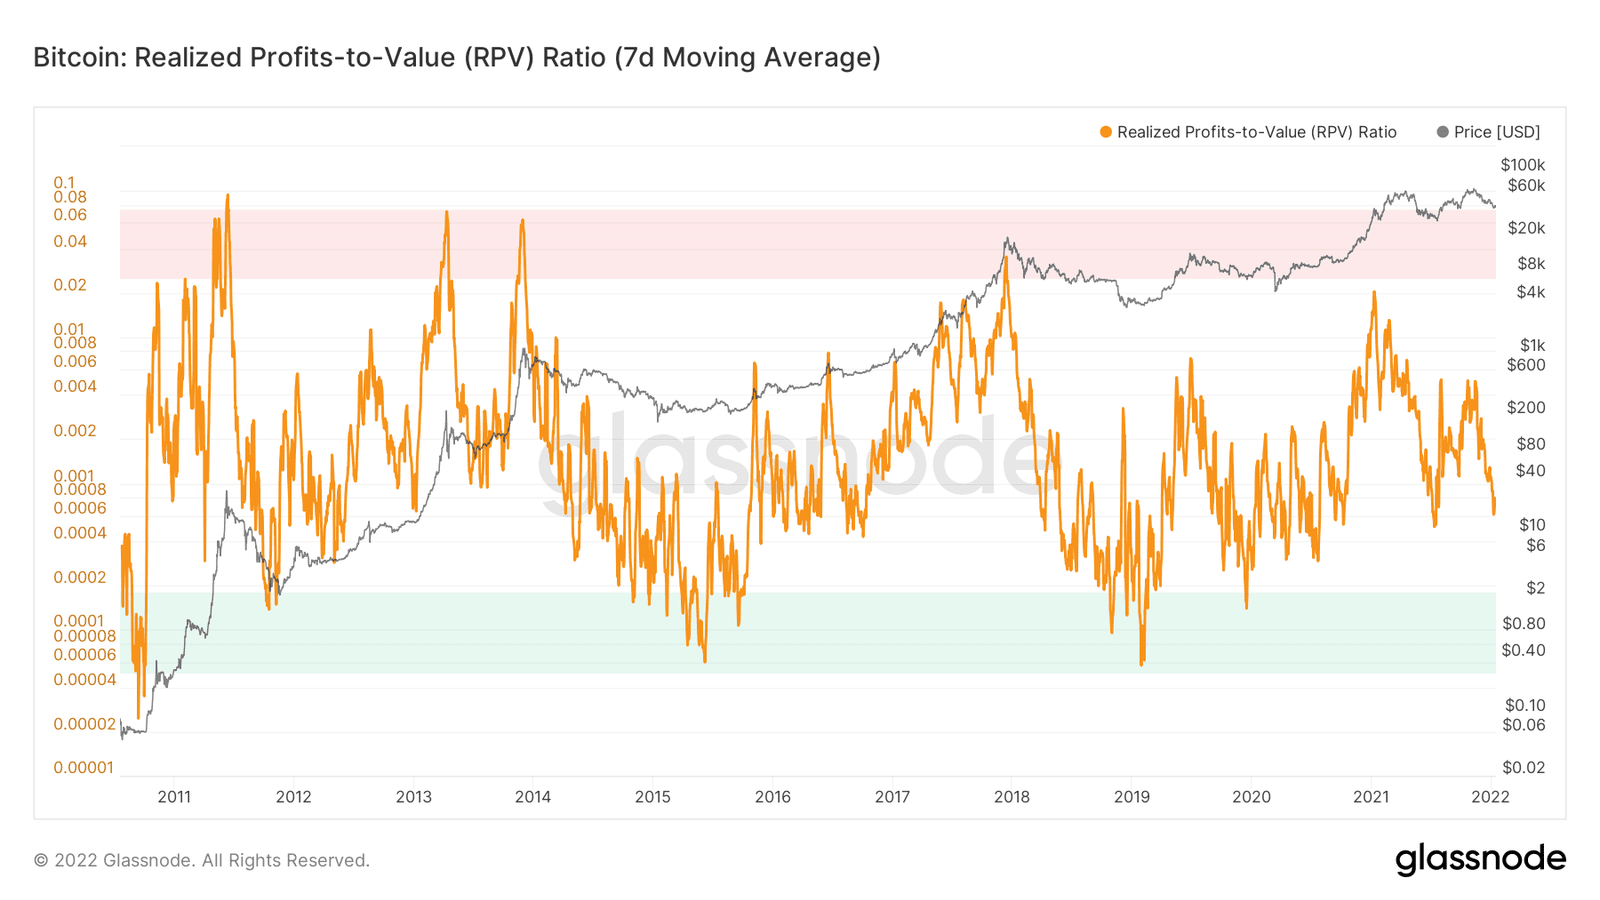
While the RPV peaks are not as apparent as those on the MVRV Z-score chart, they are still instrumental in determining the overall Bitcoin market climate.
Bitcoin’s Bearish Puell Multiple
Miners take a vital role in the crypto community. When it comes to Bitcoin prices, they can influence the market by selling or holding on to their mined BTCs. Thus, estimating the sell-pressure level coming from miners is crucial for getting a clear price forecast. That’s when an indicator called ‘Puell Multiple’ (PM) comes in.

PM is equal to the ratio of the daily coin issuance (in USD) to its 365-day moving average (in USD). If the PM is high, current miner profitability is higher than the yearly average. Low values indicate the opposite. The Glassnode report showed that Bitcoin Puell Multiple was low compared to the early 2021 peak, which indicated a possible bear market ahead.
Also read: Bitcoin price rose above $44K as US inflation rate breaks 39-year record.
The ‘Bitcoin to $100K’prognosis did not pan out in December 2021, and the metrics listed above conclude that 2022 might not be Bitcoin’s lucky year, either. However, the Federal Reserve’s hawkish policy against the rising inflation could significantly influence the market and navigate a course for the leading cryptocurrency as well.

… [Trackback]
[…] Information to that Topic: coinchapter.com/4-bitcoin-indicators-that-show-why-btc-price-wont-go-back-to-69k-in-2022/ […]
… [Trackback]
[…] Read More on to that Topic: coinchapter.com/4-bitcoin-indicators-that-show-why-btc-price-wont-go-back-to-69k-in-2022/ […]