On June 5, 2025, the Binance Coin to Tether(BNB/USDT) pair created an ascending channel pattern on the 4-hour chart.
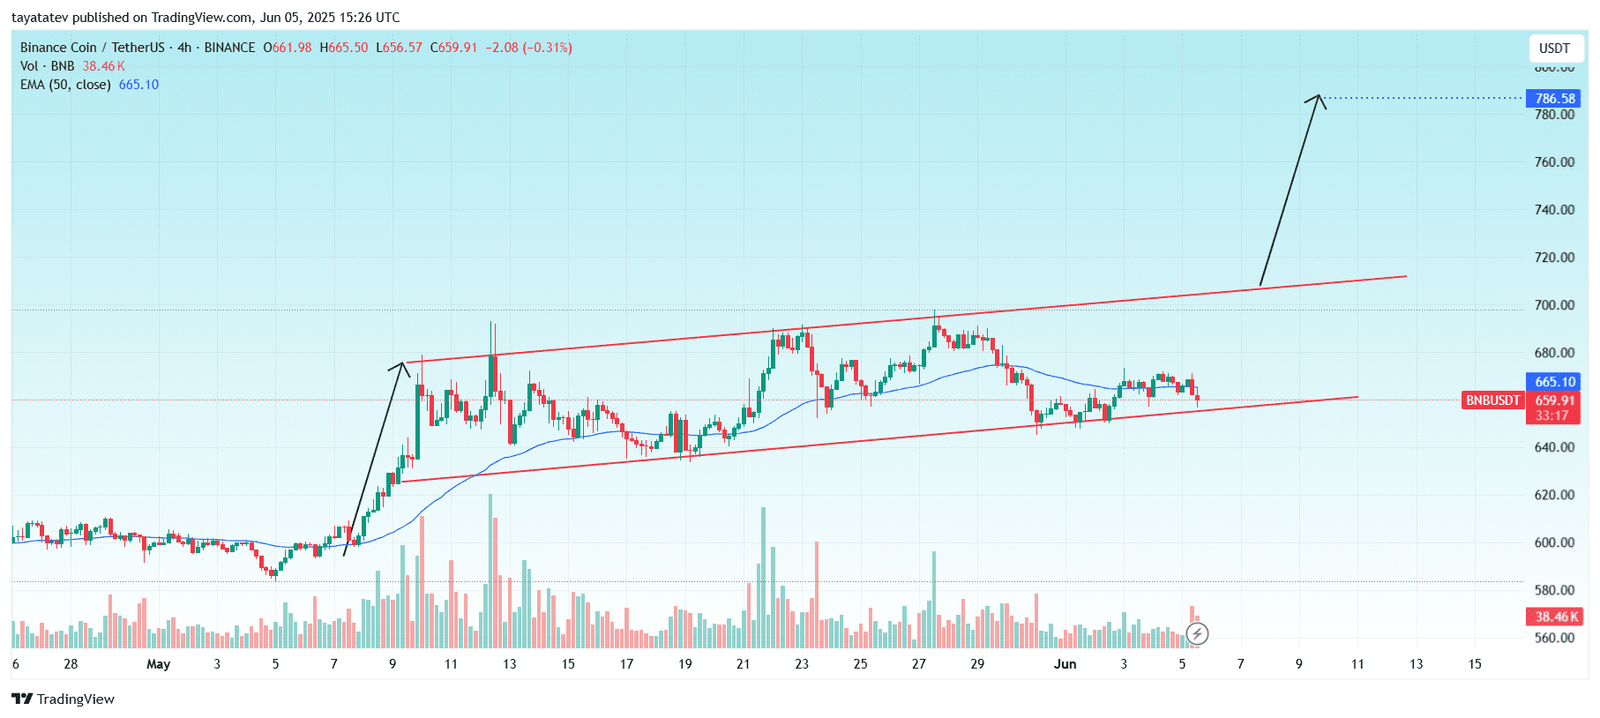
An ascending channel pattern forms when the price moves between two upward-sloping parallel trendlines, usually signaling a continuation of the current uptrend.
Currently, BNB/USDT trades at $659.91 and hovers near the lower boundary of the channel, which acts as dynamic support. The price remains slightly below the 50-period Exponential Moving Average (EMA), now at $665.10. If buyers defend this support level and volume picks up, the price may bounce within the channel again.
If the pattern confirms with a breakout above the upper red trendline, the price could rally as much as 79 percent from the current level to the projected target of $786.58.
So far, trading volume remains low, suggesting weak conviction. However, if a breakout occurs with strong bullish candles and increased volume, it would validate the ascending channel setup and open the door to significant upside.
BNB/USDT MACD Signals Bearish Crossover, Momentum Weakens
On June 5, 2025, the Moving Average Convergence Divergence (MACD) indicator for Binance Coin to Tether (BNB/USDT) on the 4-hour chart showed a fresh bearish signal.
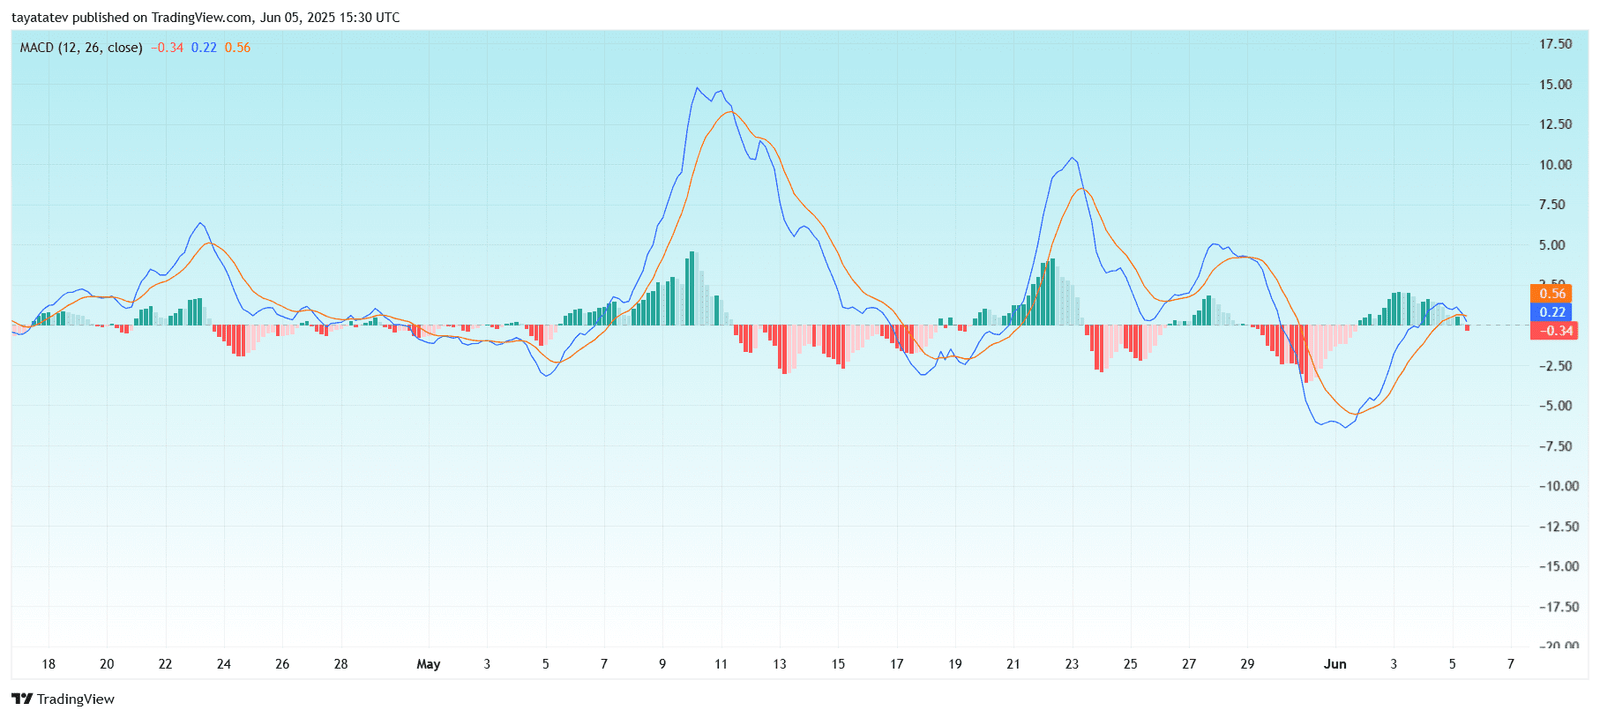
The MACD line (blue) now stands at 0.22, while the signal line (orange) is at 0.56. The MACD histogram has flipped to red at –0.34, confirming a bearish crossover just above the zero line. This crossover indicates that bullish momentum has faded and selling pressure may be increasing.
Earlier in the week, the MACD line rose sharply above the signal line, producing a wave of green histogram bars. However, the current decline in both the MACD line and histogram shows that buyers have lost strength.
If the MACD line drops further below the signal line and the histogram expands in red, bearish momentum may intensify. A return above the signal line would be needed to reverse the setup, but for now, momentum tilts to the downside.
BNB/USDT DMI Turns Bullish as ADX Rises Above Key Level
On June 5, 2025, the Directional Movement Index (DMI) for Binance Coin to Tether (BNB/USDT) showed a potential bullish trend forming on the 4-hour chart.
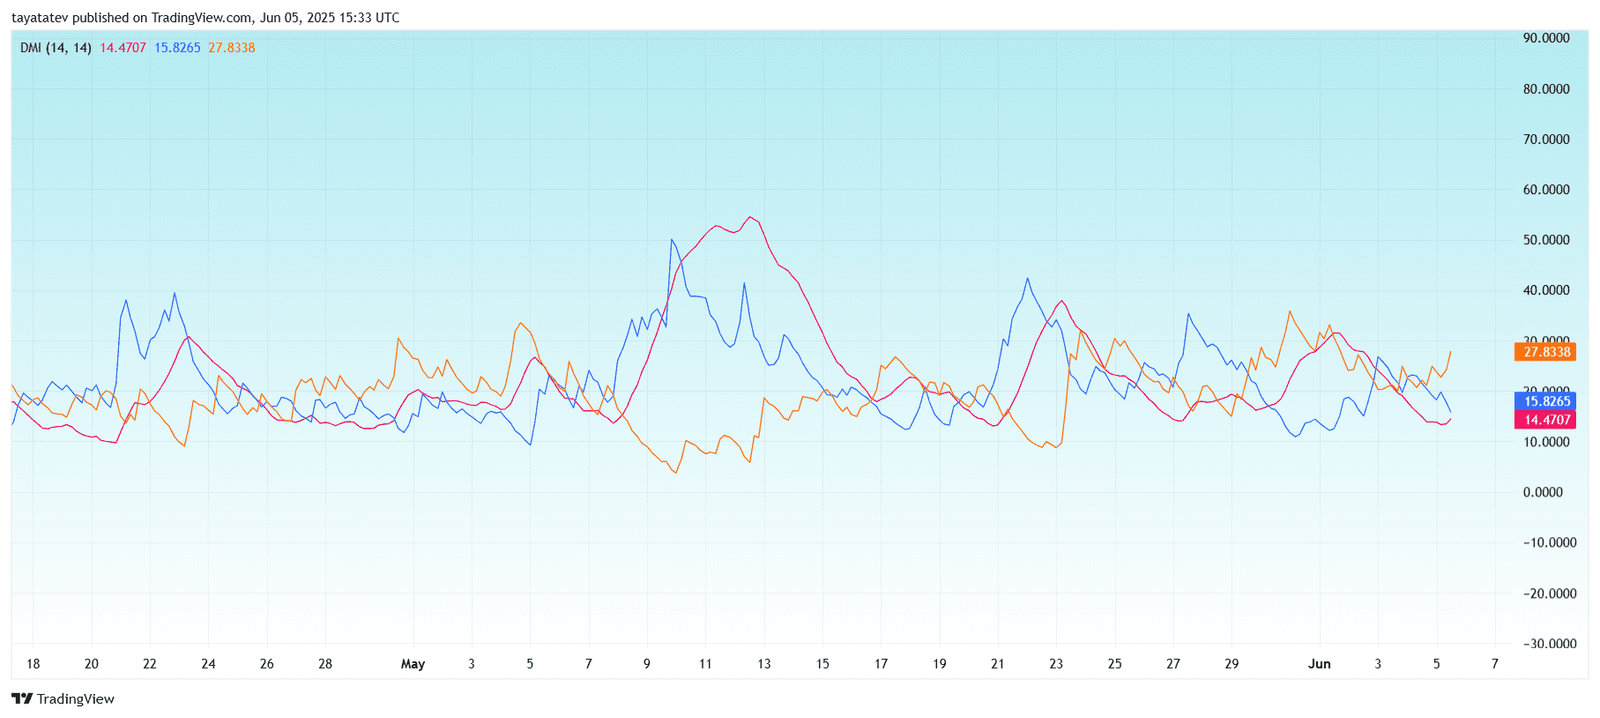
The Positive Directional Indicator (+DI), shown in orange, is at 27.83, while the Negative Directional Indicator (–DI), in red, is at 14.47. This gap signals that bulls are currently in control. Meanwhile, the Average Directional Index (ADX), in blue, stands at 15.83, showing that trend strength is still moderate but improving.
Previously, +DI and –DI crossed back and forth, indicating indecision. However, with +DI now pulling away from –DI and ADX slowly rising, the setup shows a shift toward upward momentum. For confirmation, ADX must continue to climb above 20, which would signal a strengthening trend.
If current conditions hold and ADX increases, BNB/USDT could be setting up for a bullish continuation. If ADX stalls or drops again, the trend may remain weak or short-lived.
