Key Takeaways
- Enzyme Finance prices decline to critical support level.
- Threat of further correction remains, which can push prices down by 18%.
- If Enzyme breaches the next support level, prices could fall to $45.229 before rebounding.
NEW DELHI (CoinChapter.com) — Enzyme Finance, the on-chain asset management protocol, failed to maintain its upside bias. As the MLN token’s price corrected, Enzyme lost nearly all the gains made this week. Moreover, MLN price charts indicate chances of a breakdown below the current support level, which may pull prices down by 18%
MLN Price Chart
The Enzyme token rose by almost 22% on July 5, boosted by its addition to Binance’s global trading platform. However, MLN failed to consolidate this boost, and prices started falling from the next day. The token fell 32.4% from Monday’s high of $120.174 to July 9’s low of $81.001.

The 20-Day (Green) Exponential Moving Average and 50-Day (Yellow) Moving Average have formed a critical support confluence for MLN at the $81 price level. However, the 50-Day MA seems to be moving above the MLN prices, indicating a short-term bearish trend shortly.
Additionally, if the price continues its downward trend, the next support is on the ascending trend line at $60.856. The 200-Day (Violet) Moving Average is at the same level. For now, MLN is bullish in the long term. However, if prices breach the 200-Day MA, it may create a selling sentiment in investors, further pulling down prices. A breach of the trend line and 200-Day support level could see prices falling to $45.229 support before rebounding.
Also Read: Crypto market loses $78bn intraday as Bitcoin drops towards $32K
If the Enzyme token manages to rebound from the 20-50 MA confluence of the trend line support, an upward rally will test the resistance at $124.609. Interestingly, MLN has failed to breach the $124 level since June 9.
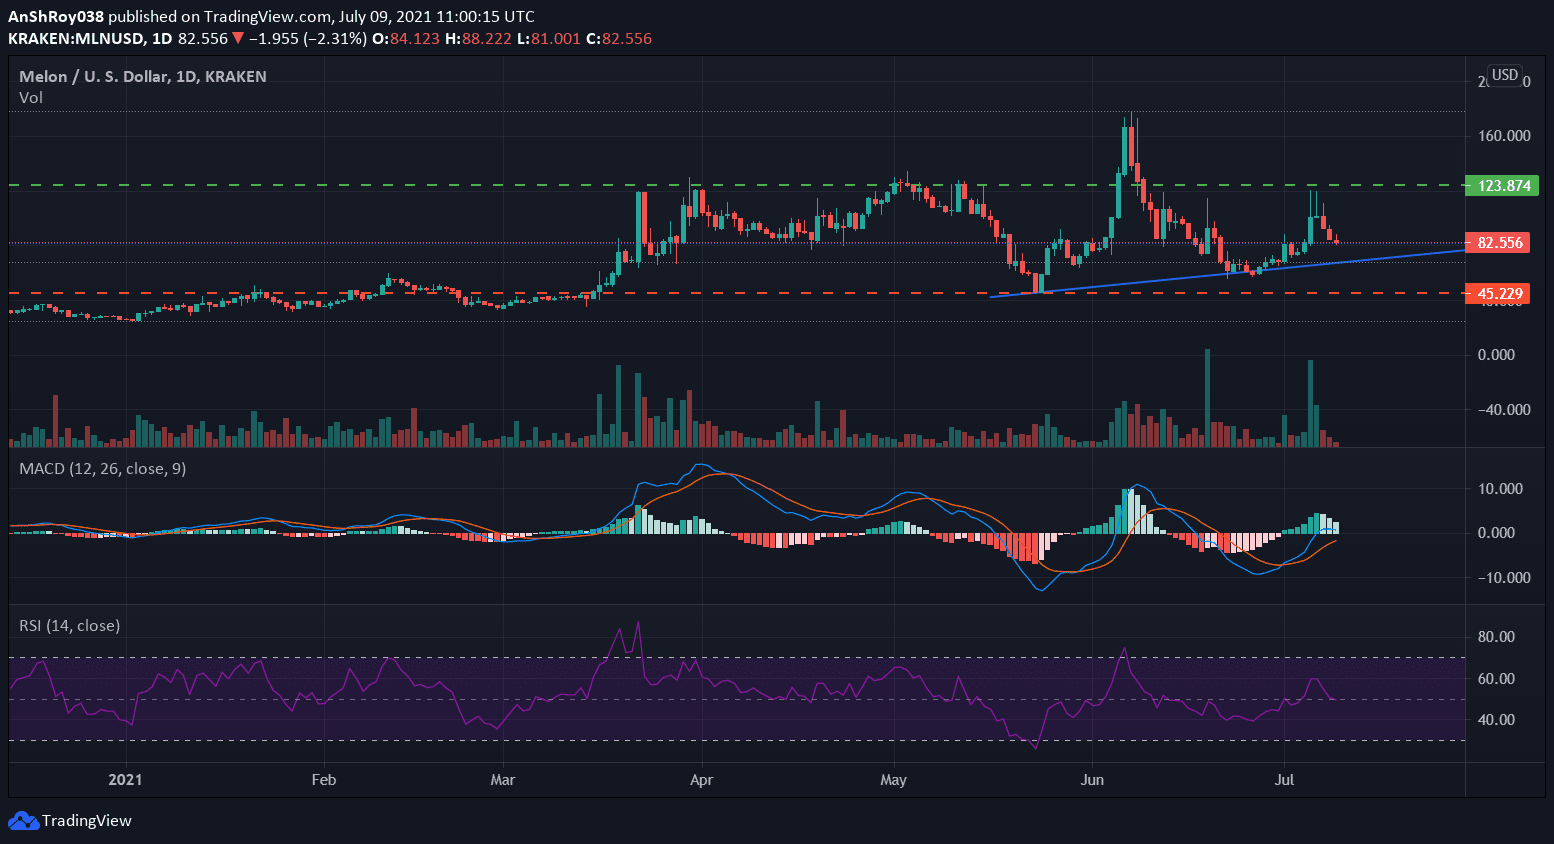
Conversely, the MACD trend-based oscillator keeps hopes alive for the bulls. The MACD line (a difference between 12-Day and 26-Day EMA on the daily chart) is above the MACD signal line (9-Day EMA of MACD), indicating bullish momentum for MLN. In addition, the MACD histogram is above zero too.
The relative strength index for the Enzyme token is 49.12. Although neutral for now, the RSI line is moving downwards towards oversold levels.
Other Enzyme Updates
Enzyme Finance is an Ethereum-based protocol that aims to decentralize traditional asset management. The idea is to make asset management available to more investors globally. Using Enzyme, users can invest in funds and portfolios of other users, with a minimal fee paid in MLN.
Also Read: Here’s why this crypto analyst thinks altcoins are close to bottoming.
On July 5, Enzyme announced that it has teamed up with DeFi protocol Yearn to offer better yield opportunities for its users. Yearn Finance is a group of Ethereum-based protocols that allow users to engage in yield farming. At the time of writing, Yearn Finance had a total locked value of $3.96 billion. Moreover, the total value locked in Enzyme has jumped from $39.74 million on June 15 to $86.8 million on July 9.
Another boost for MLN is an endorsement by Coinshare Ventures, a venture capital firm based in London. In an article, the firm explained how Enzyme is transforming fund management.
Although the fundamentals for Enzyme remain strong, if MLN fails to rebound from its current support level, a bearish rally may begin soon. At the time of writing, the Enzyme token was trading at $81.325.

… [Trackback]
[…] Read More here on that Topic: coinchapter.com/mln-declines-to-key-support-confluence-but-risks-18-correction/ […]
… [Trackback]
[…] Information on that Topic: coinchapter.com/mln-declines-to-key-support-confluence-but-risks-18-correction/ […]
… [Trackback]
[…] Find More to that Topic: coinchapter.com/mln-declines-to-key-support-confluence-but-risks-18-correction/ […]
… [Trackback]
[…] Find More to that Topic: coinchapter.com/mln-declines-to-key-support-confluence-but-risks-18-correction/ […]
… [Trackback]
[…] Read More on that Topic: coinchapter.com/mln-declines-to-key-support-confluence-but-risks-18-correction/ […]
free chat now is 321chat safe
бонуси казіно казіно з бонусами
Огляди https://seetheworld.top про st moritz читав для порівняння.
Независимый сюрвей в Москве: проверка грузов и объектов, детальные отчёты, фотофиксация и экспертные заключения. Прозрачная стоимость сюрвейерских услуг, официальные гарантии и быстрая выездная работа по столице и области.
Идеальные торты на заказ — для детей и взрослых. Поможем выбрать начинку, оформление и размер. Десерт будет вкусным, свежим и полностью соответствующим вашей идее.
ЦВЗ в Краснодаре https://cvzcentr.ru место, где пациентов внимательно выслушивают, проводят глубокую диагностику и составляют эффективный план улучшения состояния при вегетативных расстройствах.
Explore a true https://caucasustravel.ru where welfare comes first. No chains or performances — only open landscapes, gentle care, rehabilitation programs and meaningful visitor experiences.
La infraestructura https://novo-sancti-petri.es y la tecnologia vial europeas equilibran la innovacion y la sostenibilidad. Semaforos inteligentes, carreteras verdes, centros de transporte seguros y proyectos que marcan la pauta para la industria global.
La Rome Espresso https://laromeespresso.es es un lugar donde la cultura del cafe se convierte en arte. Descubre el camino del grano a la taza: el sabor profundo, las tecnicas precisas y los rituales que crean la bebida perfecta.
Do you love excitement? roulettino login delights players with high-quality slots, live tables, tournaments, and ongoing promotions. The gameplay is smooth and dynamic.
Rodaballo al Horno https://rodaballoalhorno.es es un viaje a las raices musicales del mundo, donde los sabores de las culturas se entrelazan con sus melodias. Exploramos los ritmos de las naciones, los sonidos de las tradiciones y como diferentes historias se fusionan en un solo sonido armonioso.
Un portal sobre videojuegos https://tejadospontevedra.es, noticias y tendencias para quienes viven y respiran videojuegos: resenas, guias, parches, anuncios, analisis de tecnologia y torneos de esports. Todo para gamers y quienes quieran mantenerse informados.
Нужна легализация? https://www.legalizaciya-nedvizhimosti-v-chernogorii.me проводим аудит объекта, готовим документы, улаживаем вопросы с кадастром и муниципалитетом. Защищаем интересы клиента на каждом этапе.
Скрайд MMORPG https://vk.com/scryde.russia культовая игра, где магия переплетается с технологией, а игрокам доступны уникальные классы, исторические миссии и масштабные PvP-сражения. Легенда, которую продолжают писать тысячи игроков.
Постоянно мучает насморк – перейти на страницу
Бренд MAXI-TEX https://maxi-tex.ru завода ООО «НПТ Энергия» — профессиональное изготовление изделий из металла и металлобработка в Москве и области. Выполняем лазерную резку листа и труб, гильотинную резку и гибку, сварку MIG/MAG, TIG и ручную дуговую, отбортовку, фланцевание, вальцовку. Производим сборочные единицы и оборудование по вашим чертежам.
Эвакуатор в Москве https://eva77.ru вызов в любое время дня и ночи. Быстрая подача, профессиональная погрузка и доставка авто в сервис, гараж или на парковку. Надёжно, безопасно и по фиксированной цене.
Хочешь развлечься? купить мефедрон федерация – это проводник в мир покупки запрещенных товаров, можно купить гашиш, купить мефедрон, купить кокаин, купить меф, купить экстази, купить альфа пвп, купить гаш в различных городах. Москва, Санкт-Петербург, Краснодар, Владивосток, Красноярск, Норильск, Екатеринбург, Мск, СПБ, Хабаровск, Новосибирск, Казань и еще 100+ городов.
1win кабинет 1win играть
бонуси казіно бонуси в казино
Компания Таврнеруд https://tareksa.ru производство и продажа нерудных материалов, сервис логистических услуг, а также проектирование в области технологии обогащения нерудных материалов, проведение лабораторных испытаний нерудных материалов.
Do you love puzzles? This puzzle board game features challenging levels, well-thought-out mechanics, and relaxing gameplay. Solve riddles, unlock new levels, and test your problem-solving skills anytime, anywhere.
Нужен сайт? разработка сайтов на 1с-битрикс включает проектирование, удобный интерфейс, быструю загрузку, интеграцию с 1С и CRM. Подбираем решения под задачи бизнеса и обеспечиваем техническое сопровождение.
Нужен сервер? сервера с GPU лучшие по мощности и стабильности. Подходят для AI-моделей, рендеринга, CFD-симуляций и аналитики. Гибкая конфигурация, надежное охлаждение и поддержка нескольких видеокарт.
найкращі слоти найкращі слоти
ігри слоти слоти безкоштовно
ігри казино ігри казино онлайн
aplikacja mostbet na androida mostbet
aplikacja mostbet na androida mostbet osobisty
новости границы беларуси последние новости беларуси
Visit an elephant sanctuary to see elephants living in natural landscapes, receiving care, rehabilitation and freedom from exploitation. Ethical tours focus on education, conservation and respectful observation.
Experience an elephant sanctuary where welfare comes first. Walk alongside elephants, watch them bathe, feed them responsibly and discover how conservation efforts help protect these majestic animals.
An ethical elephant sanctuary provides rescued elephants with medical care, natural habitats and social groups. Visitors contribute to conservation by learning, observing and supporting sustainable wildlife programs.
Бренд MAXI-TEX https://maxi-tex.ru завода ООО «НПТ Энергия» — это металлообработка полного цикла с гарантией качества и соблюдением сроков. Выполняем лазерную резку листа и труб, гильотинную резку и гибку, сварку MIG/MAG, TIG и ручную дуговую, отбортовку, фланцевание, вальцовку, а также изготовление сборочных единиц и оборудования по вашим чертежам.
Нужен сервер? здесь лучшие по мощности и стабильности. Подходят для AI-моделей, рендеринга, CFD-симуляций и аналитики. Гибкая конфигурация, надежное охлаждение и поддержка нескольких видеокарт.
Регулярно мучает насморк – спрей от заложенности носа
Изготавливаем каркас лестницы из металла на современном немецком оборудовании — по цене стандартных решений. Качество, точность реза и долговечность без переплаты.
The latest news crypto: Bitcoin, altcoins, NFTs, DeFi, blockchain developments, exchange reports, and new technologies. Fast, clear, and without unnecessary noise—everything that impacts the market.
Latest news crypto: price rises and falls, network updates, listings, regulations, trend analysis, and industry insights. Follow market movements in real time.
Купить шпон https://opus2003.ru в Москве прямо от производителя: широкий выбор пород, стабильная толщина, идеальная геометрия и высокое качество обработки. Мы производим шпон для мебели, отделки, дизайна интерьеров и промышленного применения.
вывод из запоя лучшие https://alcodetox-med.ru
вывод из запоя отзывы https://narkonet.su
вывод из запоя круглосуточно https://narcology-moskva.ru
Доставка грузов https://china-star.ru из Китая под ключ: авиа, авто, море и ЖД. Консолидация, проверка товара, растаможка, страхование и полный контроль транспортировки. Быстро, надёжно и по прозрачной стоимости.
Доставка грузов https://lchina.ru из Китая в Россию под ключ: море, авто, ЖД. Быстрый расчёт стоимости, страхование, помощь с таможней и документами. Работаем с любыми объёмами и направлениями, соблюдаем сроки и бережём груз.
Гастродача «Вселуг» https://gastrodachavselug1.ru фермерские продукты с доставкой до двери в Москве и Подмосковье. Натуральное мясо, молоко, сыры, сезонные овощи и домашние заготовки прямо с фермы. Закажите онлайн и получите вкус деревни без лишних хлопот.
Логистика из Китая https://asiafast.ru без головной боли: доставка грузов морем, авто и ЖД, консолидация на складе, переупаковка, маркировка, таможенное оформление. Предлагаем выгодные тарифы и гарантируем сохранность вашего товара.
Независимый сюрвейер https://gpcdoerfer1.com в Москве: экспертиза грузов, инспекция контейнеров, фото- и видеопротокол, контроль упаковки и погрузки. Работаем оперативно, предоставляем подробный отчёт и подтверждаем качество на каждом этапе.
Онлайн-ферма https://gvrest.ru Гастродача «Вселуг»: закажите свежие фермерские продукты с доставкой по Москве и Подмосковью. Мясо, молоко, сыры, овощи и домашние деликатесы без лишних добавок. Удобный заказ, быстрая доставка и вкус настоящей деревни.
Доставка грузов https://china-star.ru из Китая для бизнеса любого масштаба: от небольших партий до контейнеров. Разработаем оптимальный маршрут, оформим документы, застрахуем и довезём груз до двери. Честные сроки и понятные тарифы.
Recommended reading: https://bodenbelaege-roteco.de/buy-tiktok-accounts-with-followers-gain-instant-5/
The most useful for you: https://akashjadhav.com/reshenija-dlja-mediabainga-i-arbitrazha/common-pitfalls-in-traffic-arbitrage-and-how-to/
Платформа для работы https://skillstaff.ru с внешними специалистами, ИП и самозанятыми: аутстаффинг, гибкая и проектная занятость под задачи вашей компании. Найдем и подключим экспертов нужного профиля без длительного найма и расширения штата.
Клиника проктологии https://proctofor.ru в Москве с современным оборудованием и опытными врачами. Проводим деликатную диагностику и лечение геморроя, трещин, полипов, воспалительных заболеваний прямой кишки. Приём по записи, без очередей, в комфортных условиях. Бережный подход, щадящие методы, анонимность и тактичное отношение.
Колодцы под ключ https://kopkol.ru в Московской области — бурение, монтаж и обустройство водоснабжения с гарантией. Изготавливаем шахтные и бетонные колодцы любой глубины, под ключ — от проекта до сдачи воды. Работаем с кольцами ЖБИ, устанавливаем крышки, оголовки и насосное оборудование. Чистая вода на вашем участке без переплат и задержек.
Инженерные изыскания https://sever-geo.ru в Москве и Московской области для строительства жилых домов, коттеджей, коммерческих и промышленных объектов. Геология, геодезия, экология, обследование грунтов и оснований. Работаем по СП и ГОСТ, есть СРО и вся необходимая документация. Подготовим технический отчёт для проектирования и согласований. Выезд на объект в короткие сроки, прозрачная смета, сопровождение до сдачи проекта.
Доставка дизельного топлива https://ng-logistic.ru для строительных компаний, сельхозпредприятий, автопарков и промышленных объектов. Подберём удобный график поставок, рассчитаем объём и поможем оптимизировать затраты на топливо. Только проверенные поставщики, стабильное качество и точность дозировки. Заявка, согласование цены, подача машины — всё максимально просто и прозрачно.
Доставка торфа https://bio-grunt.ru и грунта по Москве и Московской области для дач, участков и ландшафтных работ. Плодородный грунт, торф для улучшения структуры почвы, готовые земляные смеси для газона и клумб. Быстрая подача машин, аккуратная выгрузка, помощь в расчёте объёма. Работаем с частными лицами и организациями, предоставляем документы. Сделайте почву на участке плодородной и готовой к посадкам.
Строительство домов https://никстрой.рф под ключ — от фундамента до чистовой отделки. Проектирование, согласования, подбор материалов, возведение коробки, кровля, инженерные коммуникации и внутренний ремонт. Работаем по договору, фиксируем смету, соблюдаем сроки и технологии. Поможем реализовать дом вашей мечты без стресса и переделок, с гарантией качества на все основные виды работ.
Геосинтетические материалы https://stsgeo.ru для строительства купить можно у нас с профессиональным подбором и поддержкой. Продукция для укрепления оснований, армирования дорожных одежд, защиты гидроизоляции и дренажа. Предлагаем геотекстиль разных плотностей, георешётки, геомембраны, композитные материалы.
Доставка грузов https://avalon-transit.ru из Китая «под ключ» для бизнеса и интернет-магазинов. Авто-, ж/д-, морские и авиа-перевозки, консолидация на складах, проверка товара, страхование, растаможка и доставка до двери. Работаем с любыми партиями — от небольших отправок до контейнеров. Прозрачная стоимость, фотоотчёты, помощь в документах и сопровождение на всех этапах логистики из Китая.
последние новости беларуси новости беларуси
Технические эксперты рекомендуют что безопаснее кракен онион адреса версии v3 по сравнению с клир зеркалами благодаря криптографической защите на протокольном уровне Tor.
Самое важное сегодня: диета при диабете
Анонимная экосистема kraken даркнет функционирует с 2020 года без единого exit scam демонстрируя стабильность инфраструктуры и надежность технической реализации платформы.
Strona internetowa mostbet – zaklady sportowe, zaklady e-sportowe i sloty na jednym koncie. Wygodna aplikacja mobilna, promocje i cashback dla aktywnych graczy oraz roznorodne metody wplat i wyplat.
Odkryj mostbet casino: setki slotow, stoly na zywo, serie turniejow i bonusy dla aktywnych graczy. Przyjazny interfejs, wersja mobilna i calodobowa obsluga klienta. Ciesz sie hazardem, ale pamietaj, ze masz ukonczone 18 lat.
Got a breakdown? https://locksmithsinwatford.com service available to your home or office.
Хочешь айфон? iphone выгодное предложение на новый iPhone в Санкт-Петербурге. Интернет-магазин i4you готов предложить вам решение, которое удовлетворит самые взыскательные требования. В нашем каталоге представлена обширная коллекция оригинальных устройств Apple. Каждый смартфон сопровождается официальной гарантией производителя сроком от года и более, что подтверждает его подлинность и надёжность.
Расширенный обзор: https://medim-pro.ru/kupit-osvobozhdenie-ot-fizkultury/
шлюхи метро русские шлюхи видео
Оформление медицинских анализов https://medim-pro.ru и справок без очередей и лишней бюрократии. Запись в лицензированные клиники, сопровождение на всех этапах, помощь с документами. Экономим ваше время и сохраняем конфиденциальность.
The best undress ai for digital art. It harnesses the power of neural networks to create, edit, and stylize images, offering new dimensions in visual creativity.
Free video chat emerald chat no signup find people from all over the world in seconds. Anonymous, no registration or SMS required. A convenient alternative to Omegle: minimal settings, maximum live communication right in your browser, at home or on the go, without unnecessary ads.
Free video chat learn more find people from all over the world in seconds. Anonymous, no registration or SMS required. A convenient alternative to Omegle: minimal settings, maximum live communication right in your browser, at home or on the go, without unnecessary ads.
Free video chat beta emerald chat find people from all over the world in seconds. Anonymous, no registration or SMS required. A convenient alternative to Omegle: minimal settings, maximum live communication right in your browser, at home or on the go, without unnecessary ads.
Recent Changes: https://www.indiegogo.com/en/profile/npprteam12#/overview
Don’t miss it here: https://podcasts.apple.com/fi/podcast/puzzlefree/id1697682168?i=1000737822998
A sophisticated ai music generator can mimic specific styles of famous classical composers.
Интернет-магазин https://stsgeo-krd.ru геосинтетических материалов в Краснодар: геотекстиль, георешётки, геоматериалы для дорог, фундаментов и благоустройства. Профессиональная консультация и оперативная доставка.
Геосинтетические материалы https://stsgeo-spb.ru для строительства и благоустройства в Санкт-Петербурге и ЛО. Интернет-магазин геотекстиля, георешёток, геосеток и мембран. Работаем с частными и оптовыми заказами, быстро доставляем по региону.
Строительные геоматериалы https://stsgeo-ekb.ru в Екатеринбурге с доставкой: геотекстиль, объемные георешётки, геосетки, геомембраны. Интернет-магазин для дорожного строительства, ландшафта и дренажа. Консультации специалистов и оперативный расчет.
Нужна работа в США? как работать с драйверами : работа с заявками и рейсами, переговоры на английском, тайм-менеджмент и сервис. Подходит новичкам и тем, кто хочет выйти на рынок труда США и зарабатывать в долларах.
Многоуровневая защита обеспечивает кракен даркнет вход через двухфакторную аутентификацию TOTP, дополнительные PIN коды для критических операций и seed фразу для восстановления доступа.
Нужна работа в США? цена курса диспетчера грузоперевозок в америке онлайн с практикой : работа с заявками и рейсами, переговоры на английском, тайм-менеджмент и сервис. Подходит новичкам и тем, кто хочет выйти на рынок труда США и зарабатывать в долларах.
Срочный вызов электрика https://vash-elektrik24.ru на дом в Москве. Приедем в течение часа, быстро найдём и устраним неисправность, заменим розетки, автоматы, щиток. Круглосуточный выезд, гарантия на работы, прозрачные цены без скрытых доплат.
Uwielbiasz hazard? nv casino: rzetelne oceny kasyn, weryfikacja licencji oraz wybor bonusow i promocji dla nowych i powracajacych graczy. Szczegolowe recenzje, porownanie warunkow i rekomendacje dotyczace odpowiedzialnej gry.
Gates of Olympus https://gatesofolympus.win is a legendary slot from Pragmatic Play. Demo and real money play, multipliers up to 500x, free spins, and cascading wins. An honest review of the slot, including rules, bonus features, and tips for responsible gaming.
Онлайн курс Диспетчер грузоперевозок обучение: обучение с нуля до уверенного специалиста. Стандарты сервиса, документооборот, согласование рейсов и оплата. Пошаговый план выхода на работу у американских логистических компаний.
Хочешь ТОП? раскрутка сайта санкт-петербург как инструмент усиления SEO: эмуляция реальных пользователей, рост поведенческих факторов, закрепление сайта в ТОПе. Прозрачные отчёты, гибкая стратегия под нишу и конкурентов, индивидуальный медиаплан.
Хочешь сайт в ТОП? накрутка сайтов для быстрого роста позиций сайта. Отбираем безопасные поведенческие сценарии, повышаем кликабельность и глубину просмотра, уменьшаем отказы. Тестовый запуск без оплаты, подробный отчёт по изменениям видимости.
Комплексное seo продвижение сайтов в сша: анализ конкурентов, стратегия SEO, локальное продвижение в городах и штатах, улучшение конверсии. Прозрачная отчетность, рост позиций и трафика из Google и Bing.
Современный ремонт офисов под ключ под ключ. Поможем обновить пространство, улучшить планировку, заменить покрытия, освещение и коммуникации. Предлагаем дизайн-проект, фиксированную смету, соблюдение сроков и аккуратную работу без лишнего шума.
Our most valuable: http://sungshimsa.co.kr/bbs/board.php?bo_table=free&wr_id=95281
Нужно остекление? остекление балконов: тёплое и холодное, ПВХ и алюминий, вынос и объединение с комнатой. Бесплатный замер, помощь с проектом и документами, аккуратный монтаж и гарантия на конструкции и работу.
Online platform hyperliquid vs ethereum dex for active digital asset trading: spot trading, flexible order settings, and portfolio monitoring. Market analysis tools and convenient access to major cryptocurrencies are all in one place.
Comprehensive uae consultants: feasibility studies, market analysis, strategy, optimization of costs and processes. We help you strengthen your position in Dubai, Abu Dhabi and other Emirates.
Нужен керосин? 1 тонна авиационного керосина сертифицированное топливо по ГОСТ, поставки для аэропортов, авиапредприятий и вертолётных площадок. Помощь в подборе марки, оформление документов и быстрая доставка.
Нужен манипулятор? аренда манипулятора организуем подачу спецтехники на стройку, склад или частный участок. Погрузка, разгрузка, перевозка тяжёлых и негабаритных грузов. Оперативный расчёт стоимости и выезд в день обращения.
Профессиональное комплексный маркетинг для бизнеса: аудит, позиционирование, digital-стратегия, запуск рекламных кампаний и аналитика. Поможем вывести бренд в онлайн, увеличить трафик и заявки из целевых каналов.
Профессиональная перевозка скорая помощь подъем на этаж, помощь при пересадке, фиксирующие носилки, заботливое отношение. Организуем транспортировку в больницы, реабилитационные центры и домой.
Нужна ботулинотерапия? инъекции диспорта цена москва помогаем смягчить мимику, освежить взгляд и предупредить появление новых морщин. Осмотр врача, противопоказания, грамотное введение и контроль результата на приёме.
Trading platform hyperliquid swap combines a user-friendly terminal, analytics, and portfolio management. Monitor quotes, open and close trades, and analyze market dynamics in a single service, available 24/7.
Нужен бетон? куплю бетон о выгодной цене с доставкой на объект. Свежий раствор, точное соблюдение пропорций, широкий выбор марок для фундамента, стяжек и монолитных работ. Быстрый расчет, оперативная подача миксера.
Use swap hyperliquid to manage cryptocurrencies: a user-friendly dashboard, detailed statistics, and trade and balance tracking. Tools for careful risk management in a volatile market.
The best deepnude ai services for the USA. We’ll explore the pros and cons of each service, including speed, available effects, automation, and data privacy. Undress people in just a few clicks.
Live stream promotion benefits when you buy tiktok views on announcement posts. Pre-stream view counts generate interest driving live attendance when broadcasts begin.
Специальный протокол создает кракен onion адреса через криптографическое хеширование публичных ключей серверов что математически связывает адрес с инфраструктурой без возможности подделки.
Альтернативный kra49 домен работает как резервная точка входа на площадку при блокировках основных адресов провайдерами интернета и государственными органами.
Новинний портал Ужгорода https://88000.com.ua головні події міста, політика, економіка, культура, спорт та життя городян. Оперативні новини, репортажі, інтерв’ю та аналітика. Все важливе про Ужгород в одному місці, зручно з телефону та комп’ютера.
A cozy booking Kolasin for mountain lovers. Ski slopes, trekking trails, and local cuisine are nearby. Rooms are equipped with amenities, Wi-Fi, parking, and friendly staff are available to help you plan your vacation.
Free Online Jigsaw Puzzle https://vds96161.atualblog.com/45451097/solve-fun-online-puzzle-games play anytime, anywhere. Huge gallery of scenic photos, art and animals, customizable number of pieces, autosave and full-screen mode. No registration required – just open the site and start solving.
Нужна виза инвестора в оаэ? Подберём оптимальный вариант — через бизнес, долю в компании или недвижимость. Готовим документы, сопровождаем на всех этапах, обеспечиваем корректное прохождение комплаенса и получение резидентского статуса.
Комплексные бухгалтерский учет в оаэ: финансовая отчётность, налоговые декларации, управление первичными документами, аудит, VAT и corporate tax. Обеспечиваем точность, своевременность и полное соответствие законодательству для стабильной работы вашего бизнеса.
Профессиональное налоговое консультирование оаэ: разбираем вашу ситуацию, подбираем оптимальную корпоративную и личную структуру, помогаем учесть требования местного законодательства, корпоративного налога и substance. Сопровождаем бизнес и инвестиции на постоянной основе.
Оформление золотая виза оаэ под ключ: анализ вашей ситуации, подбор оптимальной категории (инвестор, бизнес, квалифицированный специалист), подготовка документов, сопровождение подачи и продления статуса. Удобный формат взаимодействия и конфиденциальный сервис.
Профессиональная легализация документов в оаэ: нотариальное заверение, Минюст, МИД, консульства, сертифицированные переводы. Сопровождаем весь процесс от проверки документов до финального подтверждения. Подходит для компаний, инвесторов и частных клиентов.
Профессиональное консульское сопровождение оаэ для частных лиц и бизнеса: консультации по визовым и миграционным вопросам, подготовка обращений, запись в консульство, помощь при подаче документов и получении решений. Минимизируем риски отказов и задержек.
Помогаем открыть брокерский счет в оаэ: подбор надёжного брокера, подготовка документов, прохождение KYC, сопровождение подачи и активации. Подходит для частных инвесторов, семейных офисов и компаний. Доступ к мировым рынкам и комфортные условия работы с капиталом.
Предлагаем корпоративные услуги в оаэ для действующих и новых компаний: регистрация и перерегистрация, выпуск и передача долей, протоколы собраний, обновление лицензий, KYC и комплаенс. Обеспечиваем порядок в документах и соответствие требованиям регуляторов.
Нужна поддержка по трудовым вопросам оаэ? Консультируем по трудовым договорам, рабочим визам, оформлению сотрудников, переработкам, отпускам и увольнениям. Готовим рекомендации, помогаем минимизировать риски штрафов и конфликтов между работодателем и работником.
Разработка соглашения об управлении оаэ: фиксируем правила принятия решений, распределение ролей, отчётность и контроль результатов. Учитываем особенности вашей компании, отрасли и требований регуляторов. Помогаем выстроить устойчивую систему корпоративного управления.
Want to obtain an investor visa uae? We guide you through business setup or property investment requirements, prepare documentation, submit your application and ensure smooth processing. Transparent, efficient and tailored to your goals.
Лучший ресурс сайт по продаже аккаунтов рад приветствовать арбитражников в нашем пространстве аккаунтов и знаний. Ключевое преимущество этого шопа — это наличие приватной библиотеки, в которой опубликованы секретные инструкции по заливу. На сайте вы найдете аккаунты Google, Twitter, Telegram под любые цели: начиная с саморегов до фармленными профилями с друзьями. Заказывая здесь, клиент получает не просто куки, но и оперативную поддержку, страховку на момент покупки плюс самые адекватные расценки в нише.
Мирон ищет на рутити https://rutiti.ru ищу девушку, люблю мотоциклы, занимаюсь починкой, сходим на свидание прокачу по городу, посидим в кафе, можно написать мне через чат.
Platforma internetowa mostbet: zaklady przedmeczowe i na zywo, wysokie kursy, akumulatory, zaklady na sumy i handicapy, a takze popularne sloty i kasyno na zywo. Bonus powitalny, regularne promocje, szybkie wyplaty na karty i portfele.
Prodej reziva https://www.kup-drevo.cz v Ceske republice: siroky vyber reziva, stavebniho a dokoncovaciho reziva, tramu, prken a stepky. Dodavame soukromym klientum i firmam stalou kvalitu, konkurenceschopne ceny a dodavky po cele Ceske republice.
High-performance backup server in europe. Private dedicated backup server offers the perfect alternative to Dropbox, tailored specifically for your business: data privacy Europe, GDPR, top encryption, secure file storage, flexible backup plans. Choose our European backup hosting.
Вызов электрика https://vash-elektrik24.ru на дом в Москве: оперативный выезд, поиск и устранение неисправностей, установка розеток и выключателей, подключение техники, ремонт проводки. Квалифицированные мастера, точные цены, гарантия на работы и удобное время приезда.
Хочешь сдать авто? продать авто срочно спб быстро и безопасно: моментальная оценка, выезд специалиста, оформление сделки и мгновенная выплата наличными или на карту. Покупаем автомобили всех марок и годов, включая битые и после ДТП. Работаем без скрытых комиссий.
Все современные специальности ВГУ им. Машерова в одном разделе: список факультетов, направления подготовки, краткие описания программ, длительность обучения, квалификация выпускника и основные дисциплины. Помогаем абитуриентам выбрать подходящую профессию и траекторию обучения.
Проблемы с алкоголем? вывод из запоя срочно круглосуточно: анонимная помощь, круглосуточный выезд врача, детоксикация, капельницы, стабилизация состояния и поддержка. Индивидуальный подход, современные методы и контроль здоровья. Конфиденциально и безопасно.
bukmacher internetowy mostbet oferuje szeroki wybor zakladow sportowych, zakladow na zywo i slotow od czolowych dostawcow. Oferuje szybka rejestracje, bonusy dla nowych graczy, przyjazna dla uzytkownika aplikacje mobilna, natychmiastowe wyplaty i calodobowa obsluge klienta.
Женский портал https://forthenaturalwoman.com о жизни, красоте и вдохновении: мода, уход за собой, здоровье, отношения, карьера и личные финансы. Полезные статьи, честные обзоры, советы экспертов и истории реальных женщин. Присоединяйтесь к сообществу и находите идеи для себя каждый день.
Главные новости https://mynewsmonitor.com онлайн: самые важные события дня в сжатом и понятном формате. Политика, экономика, общество, мир, наука и культура. Краткие сводки, развёрнутые статьи, мнения экспертов и удобная лента, которая обновляется в режиме реального времени.
Актуальные и главные https://allnews.in.ua новости: короткие заметки о срочных событиях и развёрнутые аналитические материалы. Помогаем понять, что произошло, почему это важно и к чему может привести. Лента обновляется в течение дня, чтобы вы не упустили ничего значимого.
Главные новости https://newsline.in.ua онлайн: от срочных сообщений до глубоких обзоров и экспертных комментариев. Политика, экономика, безопасность, технологии и культура. Только проверенные факты и удобная лента, чтобы быстро ориентироваться во всём, что происходит.
Все главные https://ua-news.com.ua новости в одном потоке: актуальные события, важные решения, прогнозы, мнения и аналитика. Помогаем понять, что стоит за заголовками, как события связаны между собой и почему они значимы. Обновления в режиме реального времени.
Главные новости https://ukrnews.in.ua сегодня: политика, экономика, международные события, наука, культура и общественные темы. Оперативные сводки, анализ и подробные статьи. Полная картина дня, собранная в одном месте для удобного и быстрого чтения.
Современный авто https://cargurus.com.ua портал: свежие новости, премьеры, обзоры новых и подержанных автомобилей, тест-драйвы, советы по эксплуатации и страхованию. Удобный поиск по маркам и моделям, рейтинги, подборки и полезные материалы для автолюбителей любого уровня.
Новостной портал https://ua-today.com.ua с акцентом на достоверность: только проверенные источники, факты, комментарии экспертов и глубокая аналитика. Удобная лента событий, фильтры по темам, архив материалов и быстрый доступ к главному за день.
Онлайн авто https://autoindustriya.com.ua портал: всё об автомобилях и автожизни. Обзоры и сравнения моделей, тест-драйвы, лайфхаки по ремонту и обслуживанию, информация о кредитах и лизинге, новости рынка. Помогаем выбрать машину, понять тонкости владения и сэкономить на содержании.
Женский портал https://womanblog.com.ua с актуальными темами: тренды моды и макияжа, здоровье, фитнес, питание, саморазвитие и вдохновляющие истории. Ежедневные обновления, рекомендации специалистов и подборки идей для повседневной жизни, карьеры и личного счастья.
Современный женский https://womanstyle.com.ua портал для тех, кто хочет успевать всё: стиль и красота, психология и отношения, материнство, дом, путешествия и работа. Практичные лайфхаки, чек-листы, подборки и мотивационные материалы, которые помогают заботиться о себе и жить в балансе.
Современный новостной https://arguments.com.ua портал: главные новости дня, поясняющая аналитика, мнения экспертов и репортажи с мест событий. Лента в реальном времени, тематические рубрики, фото и видео. Помогаем разобраться в том, что происходит в стране и мире.
Авто портал https://automotive-news.com.ua для тех, кто живёт автомобилями: новости автопрома, обзоры машин, тест-драйвы, советы по выбору и обслуживанию, сравнение моделей и подбор авто по параметрам. Фото, видео, мнения экспертов и реальные отзывы владельцев в одном месте.
Строительный портал https://garden-story.com для профессионалов и частных мастеров: статьи и инструкции по ремонту, отделке и строительству, обзоры материалов и инструментов, калькуляторы, сметы, фото-примеры и советы экспертов. Всё, чтобы грамотно спланировать и выполнить работы.
Портал о ремонте https://remont-sam.com и строительстве: от подготовки проекта и сметы до отделки и декора. Подробные инструкции, обзоры инструментов, рейтинги материалов, фото-примеры и лайфхаки. Удобная навигация по темам помогает быстро найти нужное решение для вашего объекта.
Строительный портал https://sovetremont.com с практическими советами: ремонт квартир, строительство домов, инженерные системы, отделка, фасады, кровля и благоустройство. Руководства, видео, расчёты и рекомендации экспертов, которые помогают экономить время и деньги.
Портал о строительстве https://stroyline.com и ремонте: пошаговые инструкции, обзоры материалов, калькуляторы, идеи планировок и дизайна, советы мастеров и реальные примеры. Помогаем спланировать работы, избежать типичных ошибок и сэкономить время и бюджет.
Онлайн-портал https://stroyinfo.com о строительстве и ремонте для владельцев квартир, домов и дач: полезные статьи, схемы, чек-листы, подбор материалов и техники, советы по отделке и инженерным системам. Всё, чтобы сделать ремонт своими руками или грамотно контролировать подрядчиков.
Свежие новости https://ukrportal.com.ua Украины и мира: политика, экономика, общество, происшествия, аналитика и авторские материалы. Оперативные обновления 24/7, проверенные факты и объективная подача. Следите за ключевыми событиями, которые формируют будущее страны и всего мира.
Актуальные новости https://ukrmedia24.com.ua Украины и мира в одном месте: главные события дня, обзоры, комментарии экспертов, репортажи и эксклюзивные материалы. Политика, экономика, технологии, культура и спорт. Быстро, достоверно и удобно для ежедневного чтения.
Новости Украины https://ukrinfo24.com.ua и мира: оперативная информация, разбор ключевых событий, интервью, репортажи и аналитика. Только проверенные источники и объективная подача. Будьте в курсе того, что происходит в стране и на международной арене прямо сейчас.
Все новости https://uanews24.com.ua Украины и мира — быстро, достоверно и понятно: события в политике, экономике, науке, культуре и спорте. Подробные обзоры, интервью и аналитика помогают увидеть полную картину происходящего. Ежедневные обновления и удобная навигация.
Лента новостей https://uavesti.com.ua Украины и мира: самые важные события дня, актуальные темы, экспертные оценки и глубокая аналитика. Удобный формат, быстрые обновления, проверенные данные. Политика, общество, экономика, культура и мировые тенденции — всё на одной платформе.
Сайт для женщин https://golosiyiv.kiev.ua которые ценят себя и своё время: полезные статьи о моде и уходе, психологии, детях, отношениях, работе и хобби. Подборки идей, гайды, чек-листы и вдохновляющие истории. Помогаем находить баланс между заботой о других и заботой о себе.
Онлайн женский https://womenclub.kr.ua портал для девушек и женщин любого возраста: статьи про красоту и уход, отношения, семью, детей, карьеру и хобби. Удобная навигация по разделам, полезные советы, тесты и подборки, которые помогают находить ответы на важные вопросы.
Сайт для женщин https://e-times.com.ua о жизни, красоте и вдохновении: мода, макияж, уход за собой, здоровье, отношения, семья и карьера. Практичные советы, обзоры, чек-листы и личные истории. Помогаем заботиться о себе, развиваться и находить новые идеи каждый день.
Онлайн-сайт https://funtura.com.ua для женщин любого возраста: тренды моды и макияжа, здоровый образ жизни, питание, фитнес, отношения и саморазвитие. Регулярные обновления, советы экспертов и вдохновляющие материалы, которые помогают чувствовать себя увереннее каждый день.
Журнал о животных https://zoo-park.com дикая природа и домашние питомцы. Познавательные материалы, фотоистории, редкие виды, повадки, экология и ответственное содержание. Понятные гайды по уходу, выбору питомца и безопасному общению с животными.
Журнал о животных https://myzoofriend.com советы по уходу за питомцами, здоровье, питание, воспитание и поведение. Обзоры кормов и аксессуаров, рекомендации ветеринаров, истории спасения и интересные факты о кошках, собаках и дикой природе.
Авто портал https://just-forum.com с полным набором разделов: новости, обзоры, тесты, подержанные авто, советы по покупке, эксплуатации и продаже автомобиля. Честные мнения экспертов, реальные отзывы, подборки лучших моделей и удобная навигация по маркам и классам.
Новостной портал https://infonews.com.ua с полным охватом событий: оперативная лента, большие тексты, интервью и аналитика. Политика, экономика, общество, технологии, культура и спорт. Обновления в режиме реального времени и удобная структура разделов для ежедневного чтения.
Портал о даче https://sovetyogorod.com саде и огороде: статьи и гайды по уходу за почвой, посадке, обрезке, мульчированию и борьбе с болезнями растений. Обзоры инструментов, идеи для теплиц и компостеров, ландшафтные решения и полезные советы для урожая.
Женский портал https://dreamywoman.com о стиле жизни: красота и уход, мода, здоровье, психология, отношения, семья и карьера. Полезные статьи, подборки, чек-листы и вдохновляющие истории. Всё, чтобы заботиться о себе, развиваться и находить идеи на каждый день.
Новостной портал https://ua24news.com.ua Украины: оперативные события дня, политика, экономика, общество, происшествия и международная повестка. Проверенные факты, аналитика, интервью и репортажи. Узнавайте главное о жизни страны и мира в удобном формате 24/7.
Современный женский https://nova-woman.com сайт для девушек и женщин: тренды моды и макияжа, питание, фитнес, эмоциональное здоровье, отношения и саморазвитие. Понятные советы, обзоры, тесты и подборки, которые помогают чувствовать себя увереннее и счастливее.
Главные новости https://smi24.com.ua Украины в одном месте: актуальные события, мнения аналитиков, расследования, репортажи и эксклюзивные материалы. Наш новостной портал помогает понимать, что происходит в стране и как события влияют на жизнь людей.
Онлайн-новостной https://novosti24online.com.ua портал Украины: лента новостей, авторские колонки, интервью, обзоры и аналитика. Политика, социальные вопросы, экономика, международные события — всё оперативно, достоверно и понятно каждому читателю.
Новости Украины https://mediaportal.com.ua в удобном формате: лента последних событий, разделы по темам, авторские колонки и аналитика. Освещаем политику, экономику, безопасность, социальные вопросы и международные отношения. Портал для тех, кто хочет получать полную картину дня.
Новостной портал https://mediasfera.com.ua Украины для тех, кто хочет быть в курсе: свежие публикации, разбор ключевых событий, экспертные оценки и подробные материалы о политике, экономике и обществе. Быстрые обновления, удобная навигация и проверенная информация.
Женский сайт https://loveliness.kyiv.ua с практичным контентом: уход за кожей и волосами, стильные образы, дом и уют, дети, работа и финансы. Полезные рекомендации, экспертные материалы и вдохновение без лишней «воды». Удобная навигация по рубрикам и регулярные обновления.
Универсальный авто https://kolesnitsa.com.ua портал для водителей и будущих владельцев: обзоры автомобилей, сравнение комплектаций, тест-драйвы, советы по ТО и ремонту, подбор шин и аксессуаров. Актуальные новости, аналитика рынка и материалы, которые помогают делать осознанный выбор.
Онлайн женский https://lugor.org.ua сайт для тех, кто ценит своё время: гайды по красоте и стилю, психологические советы, идеи для дома, отношения, материнство и карьерные цели. Подборки, чек-листы, истории и советы, которые реально работают в повседневной жизни.
Украинский новостной https://mediacentr.com.ua портал с акцентом на объективность и факты: свежие новости, аналитические статьи, интервью и спецпроекты. Освещаем жизнь страны, реформы, фронт, дипломатию и повседневные истории людей. Всё важное — на одной площадке.
Новостной портал https://infosmi.com.ua Украины: главные события дня, оперативная лента, аналитика и мнения экспертов. Политика, экономика, общество, война и международные новости. Чёткая подача, удобная структура разделов и регулярные обновления в режиме 24/7.
Онлайн новостной https://expressnews.com.ua портал для тех, кто хочет быть в курсе: свежие новости, обзоры, спецпроекты и авторские материалы. Политика, бизнес, общество, наука, культура и спорт — всё в одном месте, с понятной подачей и регулярными обновлениями 24/7.
Украинский новостной https://medicalanswers.com.ua портал: главные новости, расширенные обзоры, разбор решений власти, ситуации на фронте и жизни граждан. Фото, видео, инфографика и мнения экспертов помогают глубже понять происходящее в Украине и вокруг неё.
Портал о технологиях https://technocom.dp.ua новости IT и гаджетов, обзоры смартфонов и ноутбуков, сравнения, тесты, инструкции и лайфхаки. Искусственный интеллект, кибербезопасность, софт, цифровые сервисы и тренды — простым языком и с пользой для читателя.
Портал смачних ідей https://mallinaproject.com.ua прості рецепти на щодень, святкові страви, десерти, випічка та корисні перекуси. Покрокові інструкції, поради, підбірки меню й лайфхаки для кухні. Готуйте швидко, смачно та з натхненням разом із нами.
Надёжный эвакуатор Дмитров — помощь на дороге 24 часа. Эвакуация легковых и коммерческих авто, кроссоверов и мотоциклов. Современная техника, фиксированная стоимость, быстрый выезд по городу и области.
Мужской портал https://phizmat.org.ua о стиле, здоровье, отношениях и деньгах. Свежие новости, честные обзоры гаджетов и авто, тренировки и питание, подборки фильмов и игр, лайфхаки для работы и отдыха — без воды и кликбейта. Советы, инструкции и тесты каждый день.
Туристический портал https://prostokarta.com.ua о путешествиях по России и миру: маршруты, города и страны, советы туристам, визы и перелёты, отели и жильё, обзоры курортов, идеи для отдыха, лайфхаки, личный опыт и актуальные новости туризма.
Срочный эвакуатор Дмитров: оперативный выезд, подача от 20 минут. Перевозка автомобилей после ДТП и поломок, межгород, бережная транспортировка. Работаем круглосуточно, без скрытых доплат, принимаем заявки в любое время.
Женский журнал https://eternaltown.com.ua о стиле, красоте и здоровье. Мода и тренды, уход за кожей и волосами, отношения и психология, дом и семья, карьера и саморазвитие. Полезные советы, подборки, интервью и вдохновение каждый день.
Профессиональное агентство интернет маркетинга для малого и среднего бизнеса. Настройка рекламы, продвижение сайтов, рост заявок и продаж. Аналитика, оптимизация и постоянный контроль эффективности рекламных кампаний.
Нужно межевание? межевание участка стоимость профессиональное межевание участка для оформления и регистрации прав. Геодезические измерения, уточнение границ, межевой план, сопровождение в Росреестре. Опытные кадастровые инженеры, точность и прозрачная стоимость.
Продажа тяговых аккумуляторных https://e-battery.ru батарей для вилочных погрузчиков – надёжные решения для стабильной работы складской техники. Подбор АКБ по параметрам, доставка, установка, долгий ресурс и высокая производительность для интенсивной эксплуатации
Нужен аккумулятор? где купить аккумулятор для авто подбор АКБ по марке и модели авто, большой выбор ёмкости и пускового тока. Доставка, самовывоз, выгодные условия и помощь в установке.
Read more on the website: https://alexisirwbe.blazingblog.com/38911009/try-free-puzzle-games-online
Курсы арабского языка https://shams-arab.ru блог с полезными статьями, упражнениями и примерами. Разбираем грамматику, лексику, диалоги и особенности языка. Делимся советами по обучению, мотивации и выбору формата занятий.
Сервис помощи https://students-helper.ru студентам с учебными работами. Курсовые, контрольные, рефераты, отчёты и презентации. Индивидуальный подход, соблюдение сроков, доработки по требованиям преподавателя и конфиденциальность.
Школа БПЛА https://obucheniebpla.ru обучение управлению беспилотными летательными аппаратами с нуля и для продвинутых. Практика полётов, основы безопасности, навигация, аэрофотосъёмка и подготовка операторов дронов по современным стандартам.
Обучение родителей https://mother-massage.ru массажу и гимнастике для детей от рождения до года. Практические занятия, безопасные техники, развитие моторики и укрепление здоровья малыша. Поддержка специалиста, пошаговые рекомендации и уверенность родителей.
Образовательный блог https://za-obrazovanie.ru о методиках обучения и развитии навыков. Статьи о преподавании, педагогике, оценивании, мотивации и работе с детьми и взрослыми. Практика, кейсы и полезные материалы.
La plateforme telecharger 1xbet burkina faso: paris sportifs en ligne, matchs de football, evenements en direct et statistiques. Description du service, marches disponibles, cotes et principales fonctionnalites du site.
Site web de pari foot rdc: paris sportifs, championnats de football, resultats des matchs et cotes. Informations detaillees sur la plateforme, les conditions d’utilisation, les fonctionnalites et les evenements sportifs disponibles.
Site web 1xbet.cd – paris sportifs en ligne sur le football et autres sports. Propose des paris en direct et a l’avance, des cotes, des resultats et des tournois. Description detaillee du service, des fonctionnalites du compte et de son utilisation au Congo.
La plateforme en ligne xbet burkina: paris sportifs en ligne, matchs de football, evenements en direct et statistiques. Description du service, marches disponibles, cotes et principales fonctionnalites du site.
Application mobile 1xbet burkina. Paris sportifs en ligne, football et tournois populaires, evenements en direct et statistiques. Presentation de l’application et de ses principales fonctionnalites.
Школа блогеров https://vdskill.ru и видеотехнологий для авторов и предпринимателей. Создание видео, сторителлинг, монтаж и продвижение. Практические занятия, поддержка наставников и актуальные инструменты для роста.
Образовательный блог https://educationruss.ru об обучении за границей. Университеты и колледжи, языковые курсы, условия поступления, стоимость, документы и жизнь студентов. Полезные статьи и рекомендации для абитуриентов и родителей.
Профессиональные обучение инъекции в косметологии теория, практика, безопасность и современные подходы к эстетическим процедурам. Помогаем получить уверенные навыки и системные знания для работы.
Блог Елены Беляевой https://bestyleacademy.ru профессионального стилиста. Разборы гардероба, капсульные коллекции, советы по стилю и актуальным трендам. Практика, вдохновение и понятные рекомендации для женщин и мужчин.
Профессиональное обучение плазмолифтингу. Осваиваем современные техники, стандарты безопасности и нюансы работы с пациентами. Теория, практика и поддержка на всех этапах обучения.
Expand details: https://soundcloud.com/desicasinos
Современная Стоматология в Воронеже лечение кариеса, протезирование, имплантация, профессиональная гигиена и эстетика улыбки. Квалифицированные специалисты, точная диагностика и забота о пациентах.
Журнал о строительстве https://prostostroy.com Ваш гид в мире стройки и ремонта. Актуальные тренды, экспертные советы, обзоры материалов и технологий. От фундамента до крыши – все, что нужно знать для успешного проекта.
Главные новости Пензы https://inpenza.ru оперативно и достоверно. Мы освещаем все значимые события, происходящие в Пензе и Пензенской области. Важные объявления, афиша, полезная информация для каждого жителя. Ваш надежный источник новостей.
Все о медицине https://zapisnapriemrostov.ru и здоровье в одном месте! Получите доступ к достоверным статьям, рекомендациям специалистов и полезным лайфхакам для поддержания отличного самочувствия. Будьте в курсе и живите полной жизнью!
Строительство и ремонт https://ctoday.ru всё, что нужно знать. Планируете стройку или обновление? Наш сайт – ваш надежный помощник. Актуальная информация о материалах, технологиях, дизайне и юридических аспектах. С нами ремонт станет проще и приятнее!
Тюмень сегодня https://kfaktiv.ru главные события города! Узнайте о последних новостях, которые формируют жизнь Тюмени. От городских инициатив до культурных событий и важных объявлений – будьте в курсе всего, что происходит в нашем любимом городе. Ваша порция актуальной информации!
Всё о секретах ПО https://software-expert.ru ваш гид. Откройте для себя мир скрытых возможностей, эффективных стратегий и неочевидных лайфхаков в разработке программного обеспечения. Поймите, как создавать и использовать ПО на новом уровне.
Все о провайдерах https://providers.by Беларуси! Актуальные новости, честные отзывы пользователей и детальные обзоры тарифов. Поможем выбрать лучшего интернет-провайдера, анализируем рынок и тенденции. Будьте в курсе всех изменений!
Сияющая кожа https://omaske.ru и роскошные локоны – легко! Откройте секреты природы для красоты. Наши домашние маски для лица и волос подарят вам натуральный уход, глубокое питание и видимый результат. Забудьте о химии, почувствуйте силу трав и фруктов!
Ремонт своими руками https://pic4you.ru портал с понятными инструкциями и советами. Этапы работ, выбор инструментов и материалов, расчёты и примеры. Помогаем сделать качественный ремонт без лишних затрат.
Красивый интерьер https://moidomiks.ru своими руками — идеи, советы и пошаговые инструкции для дома и квартиры. Декор, отделка, планировка и сочетание цветов. Помогаем создать уютное и стильное пространство без лишних затрат.
View on the website: https://velopiter.spb.ru/profile/163891-puzzlefree/?tab=field_core_pfield_1
Квартиры в Москве https://kvartira-spb-pokupka.ru для покупки — большой выбор объектов в разных районах города. Новостройки и вторичный рынок, помощь с ипотекой, юридическое сопровождение и актуальные предложения от собственников и застройщиков.
Квартиры в рассрочку https://kupikvartiru-piter.ru удобный способ покупки жилья без ипотеки. Новостройки и готовые объекты, прозрачные условия, фиксированная цена и помощь в оформлении документов. Подбор вариантов под ваши возможности.
Недорогие квартиры https://kvartira-umetro.ru для покупки: актуальные предложения, удобный поиск по цене, району и метражу. Подбор бюджетных вариантов, консультации специалистов и сопровождение сделки.
Квартиры от застройщика https://kvartiravgorod.ru покупка напрямую без переплат. Новостройки на разных стадиях готовности, современные планировки, помощь с ипотекой и сопровождение сделки от выбора до получения ключей.
Квартиры от застройщика https://kvartiravgorod.ru покупка напрямую без переплат. Новостройки на разных стадиях готовности, современные планировки, помощь с ипотекой и сопровождение сделки от выбора до получения ключей.
Однокомнатные квартиры https://kvartiradlyazhizni.ru в Москве для покупки. Большой выбор вариантов в разных районах города, удобный поиск по цене и планировке. Консультации специалистов, помощь с ипотекой и безопасное оформление сделки.
Paris sportifs 1xbet apk cameroun : matchs, tournois, cotes et resultats, lignes de paris et evenements en direct. Presentation detaillee des fonctionnalites et du fonctionnement du service.
Envie de parier? Website Service de paris sportifs et footballistiques. Presentation des evenements disponibles, des cotes, du mode direct et des principales fonctionnalites de la plateforme. Informations utiles pour les utilisateurs.
Plateforme en ligne telecharger 1xbet paris sportifs, matchs de football, evenements en direct et statistiques. Decouvrez les fonctionnalites du service, les marches disponibles et comment l’utiliser.
Квартиры от застройщика https://kvartirav-vygodno.ru напрямую — актуальные цены и выбор новостроек. Подбор по параметрам, помощь с документами, ипотекой и рассрочкой. Прозрачные условия и сопровождение сделки.
Квартиры от застройщика https://tltdomik.ru покупка в новостройках на прозрачных условиях. Современные планировки, разные стадии готовности, помощь с ипотекой и рассрочкой. Сопровождаем сделку от выбора до получения ключей.
Квартиры в новостройках https://tltnewflat24.ru и на вторичном рынке — широкий выбор объектов. Анализ плюсов и минусов, подбор под ваши задачи, консультации специалистов и юридическое сопровождение покупки.
Наш Малыш: https://malish-nash.ru Интернет-магазин товаров для детей и новорожденных. Все необходимое для комфортного роста и развития вашего ребенка.
Проблемы с зубами? стоматолог в Черногории отзывы лечение кариеса и каналов, восстановление формы и цвета зуба, замена старых пломб. Индивидуальный подход, современные технологии, стерильность. Запишитесь на консультацию и получите план лечения.
Нужны заклепки? заклепка вытяжная нержавеющая для прочного соединения листового металла и профиля. Стойкость к коррозии, аккуратная головка, надежная фиксация даже при вибрациях. Подбор размеров и типа борта, быстрая отгрузка и доставка.
Нужен эвакуатор? вызвать эвакуатор быстрый выезд по Санкт-Петербургу и области. Аккуратно погрузим легковое авто, кроссовер, мотоцикл. Перевозка после ДТП и поломок, помощь с запуском/колесом. Прозрачная цена, без навязываний.
Расширенный обзор: Продать медаль «Партизану Отечественной войны II степени» — скупка в Москве
Нужен эвакуатор? вызвать эвакуатор рядом быстрый выезд по Санкт-Петербургу и области. Аккуратно погрузим легковое авто, кроссовер, мотоцикл. Перевозка после ДТП и поломок, помощь с запуском/колесом. Прозрачная цена, без навязываний.
Current recommendations: https://taktikiipraktiki.ru/news/luchshie-igry-s-zhivymi-dilerami-v-onlajn-kazino_2.html
What we recommend now: http://sardinsolna.se/twitter-accounts-for-sale-7-effective-bookkeeping-advertisements-details/
Straight to the best here: https://africabriefing.com/gambian-protesters-demand-presidents-resignation/
Нужна косметика? корейский уход косметика большой выбор оригинальных средств K-beauty. Уход для всех типов кожи, новинки и хиты продаж. Поможем подобрать продукты, выгодные цены, акции и оперативная доставка по Алматы.
… [Trackback]
[…] Read More on that Topic: coinchapter.com/mln-declines-to-key-support-confluence-but-risks-18-correction/ […]
crazy time strategie [url=http://www.crazy-timez.com]https://crazy-timez.com/[/url]
طيب بقالي حوالي 4 شهور بلعب على 888starz apk وقلت أكتب تجربتي لأن ناس كتير بتسأل. أول حاجة إن عدد الألعاب كبير بشكل مش طبيعي — حوالي 8 آلاف لعبة بالتقريب، والجودة مش وحشة زي مواقع تانية. براجماتيك مسيطرة شوية ووطبعًا NetEnt وYggdrasil.
أنا شخصيًا مدمن Gates of Olympus، وصاحبي عايش على Book of Dead. الجديد اللي جربته كانت حاجات Microgaming ومش بطالة. إنما اللي مش عاجبني إن فلترة الألعاب بيهنج أحيانًا لما تدور على لعبة بالاسم.
جزئية الـlive هو اللي مخليني فاضل — إيفوليوشن مشغلاه، ديلرز بني آدمين والصورة نضيفة حتى بالإنترنت بتاعنا هنا. كريزي تايم بالذات مسلية جدًا، ووموجود روليت وبلاك جاك عربي وده مريح. بخصوص البونص فهو منحة 100% على أول إيداع بالإضافة لـ 150 سبين مش كلها مرة واحدة، وشرط التدوير حوالي 35 مرة وأنا شايفه عادل نسبيًا. شوف التفاصيل المحدثة على [url=https://888starz-apk19.com]ستار 888[/url] قبل ما تودع أي حاجة لأنهم بيحدثوها كتير.
التسجيل مش معقد، وأقل إيداع بسيط — مبلغ رمزي. الإيداع والسحب بيدعم كروت البنوك، محافظ إلكترونية، وعملات رقمية وده اللي بستخدمه أنا. آخر مرة سحبت خرج بعد 3 ساعات بالـUSDT، لكن بالفيزا أخد يومين تلاتة.
على الموبايل الوضع كويس — تنزيل التطبيق بيتم من موقعهم مباشرة وده طبيعي في مواقع الرهان. التحديث بيتحدث لوحده وده مريح. السبورت شغال طول الوقت بس الرد العربي بياخد وقت أطول شوية. الرخصة من كوراساو ومعروف إنه مش صارم زي مالطا، فمتحمسش وتحط أكتر من قدرتك.