

- Technical analysis of the TRON daily chart
- Possible outcomes from the current position
- What’s driving the rally?
Yerevan (CoinChapter.com) – TRON (TRX), the blockchain-based decentralized operating system, has soared 50 percent since bottoming out at $0.046 on Tuesday. The TRX/USD exchange rate stood at $0.064 in the early hours of the London session Thursday after an explosive rally.
TRON daily chart
The green candles appear to be a part of a descending channel pattern, which the token formed after the May 19 market crash. The lower trendline held support since May 23, preventing plunges. It also proved significant on June 23, when TRX retested the support.
The upper trendline acted as resistance on multiple occasions throughout the past 6 weeks, capping the sharp uptrends. TRX broke right through the mid-range margin of the formation, hinting at retesting the upper trendline in the upcoming sessions.
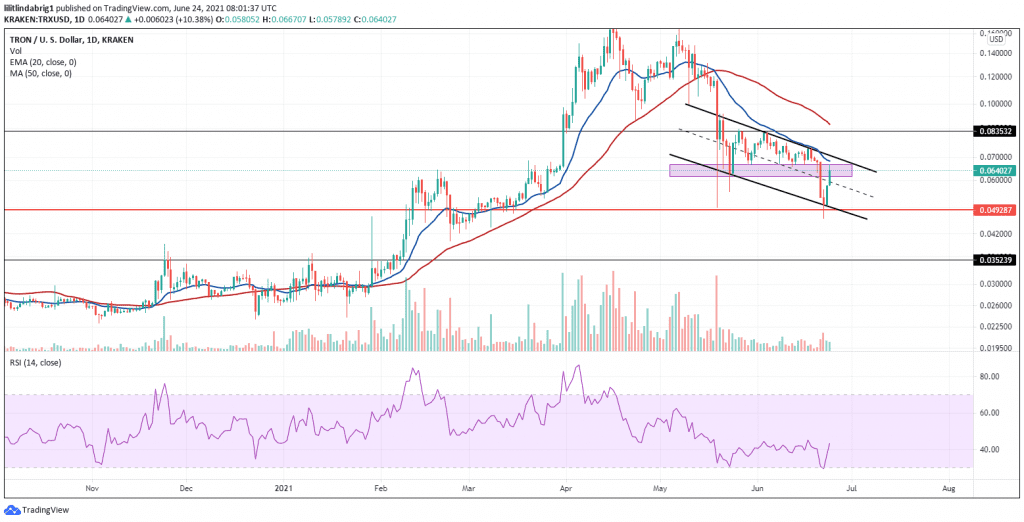
There are several other significant support/resistance lines shaping the TRON daily chart. The 20-day exponential moving average (EMA 20: blue wave) has capped breakouts in confluence with the descending channel. If TRX manages to maintain the bullish bias, it might use the EMA-20 as additional assistance. The support bar between $0.061 and $0.066 price margins could also help keep the token afloat.
Also read: Tron Becomes the Highest Issuer of Tether
Possible outcomes
The descending channel does not suggest a pronounced bullish or bearish continuation or reversal bias. Therefore, two outcomes are possible when the token discontinues trading within the channel. First, TRX could maintain the uptrend. In this case, it will face an assembly of resistance.
After conquering the mid-range line, the next significant trendlines are the EMA-20 and the resistance trendline of the channel. Should TRON make it through, it could face a crucial resistance at the $0.08 margin.
If the bullish uptrend fails, TRX has some supports to retest. The channel mid-range and the lower trendline could assist and keep the token from a sharp breakdown. Also, there are two more significant support margins in line. The $0.049 and $0.035 lines have proved their importance since November 2020.
Also read: Are whales accumulating Bitcoin between $30K and $40K?
What’s pushing TRON?
TRON has solid fundamentals to fall back on since it ranked first in transaction-per-second stats, overshadowing XRP and ADA. In addition, the number of unique accounts on the network has exceeded 40 million as of June 18. So the blockchain took to Twitter to deliver the good news to its followers.
TRON also shared its impressive weekly report. The blockchain surpassed the significant milestone of 2 billion transactions, among other metrics, presented in the tweet below.
After the successful week, another wave of crisis swept the crypto market, when China shut multiple Bitcoin mining farms in the Southwest. The news sent Bitcoin into another downward spiral, with altcoin casualties across the board. TRON also plunged, losing almost 32 percent.
However, the recovery of the market as a whole lit green candles for many of the altcoins, including TRX. It managed to log a 50 percent rally amid the recovery. The future direction of the token is not yet clear. However, TRX has a number of support and resistance lines shaping the charts.
Also read: Are Chinese miners behind the latest Bitcoin price crash?

