
Key Takeaways:
- Ethereum plans to shut down three existing testnets post merge, developers shared in a blog post.
- ETH prices might fall below $500 if the token confirms a bearish pattern.

NEW DELHI (CoinChapter.com) — Ethereum’s native token Ether prices have formed a bearish pattern called the bear pennant.
A $500 ETH price target in view
Pennants are continuation patterns. They form when a period of consolidation with converging trendlines follows a large movement in a cryptocurrency’s prices. Then, the asset breaks out in the same direction as the large initial movement.
Volumes play an important role in verifying the pattern. Per the rules of technical analysis, the consolidation should occur with lower volumes, while higher volumes should accompany breakouts.
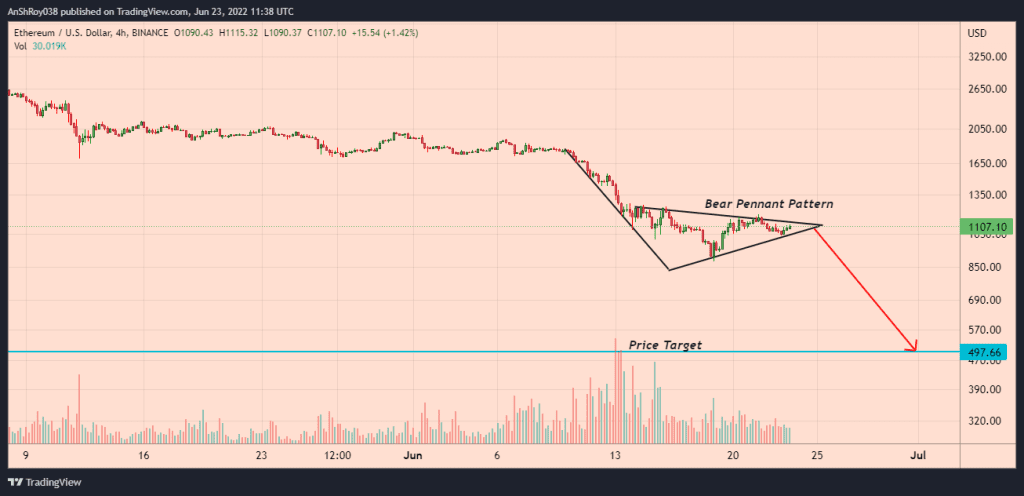
However, to confirm the pattern, Ether volumes need to move up. Otherwise, the prime altcoin would continue to consolidate below $1,100. For a bear pennant pattern, traders calculate the price target by applying the initial flagpole’s height to the point where the price breaks out from the pennant.
Also Read: Ethereum reclaims $1K but beware of ETH “fakeout.”
Hence, Ether prices could fall to $497, 55% from current price levels.
Ether Price Chart
Ether’s recent price action is evidence of the ongoing tussle between bulls and bears, with prices struggling to move above $1,100. ETH prices jumped 7.4% intraday on Thursday between low ($1,044) and high ($1,127.8).
Meanwhile, the relative strength index for ETH became neutral, clocking at 31.94 after being oversold for nearly 13 days. The RSI measures the magnitude of recent price changes to analyze overbought or oversold conditions. Traders often consider oversold RSI values as a buy signal.
Also Read: Ethereum is about to kill a multi-billion dollar mining industry — is there a way out for investors?
Furthermore, the rising RSI trendline indicates declining selling pressure for Ether prices. Therefore, if bulls start buying aggressively, Ether prices might move above immediate resistance near $1,170, which has resisted ETH’s uptrend since Jun 16.
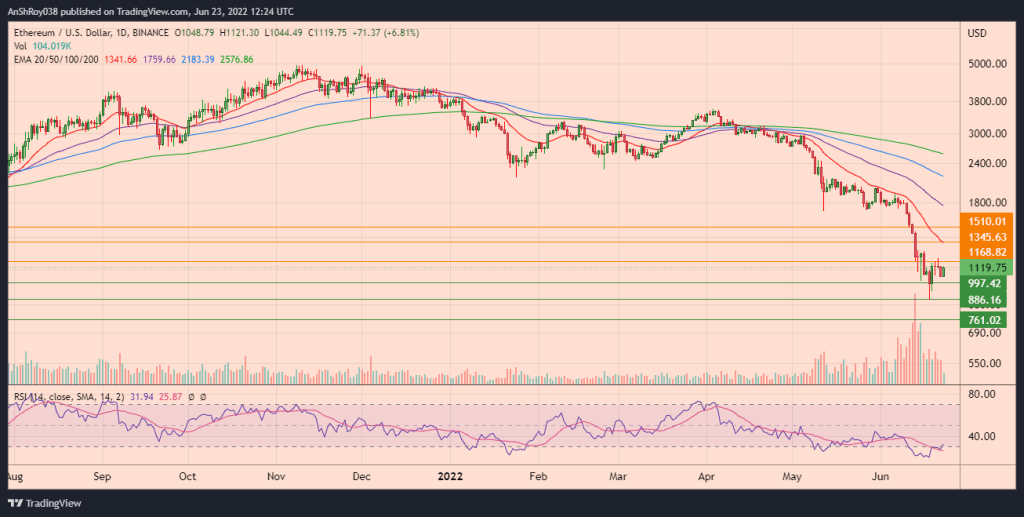
Moving above immediate resistance would help ETH prices challenge resistance from their 20-day exponential moving average (20-day EMA, red wave) near $1,350. Finally, a sustained uptrend could see ETH prices jump nearly 35% from current levels to challenge resistance near $1,500.
Conversely, the token might end up testing support near $1,000 if Ether fails to rally upwards. Breaching below immediate support would likely push ETH prices to $890. Moreover, a marketwide sell-off might result in ETH testing support near $760, a loss of 32% from current prices.
At writing, ETH was trading at $1,116, up 6.5% from current levels.

