
Key AAVE takeaways:
- Aave’s declined inflow to exchanges
- Bearish price action on the daily chart
- What’s ahead for the token?
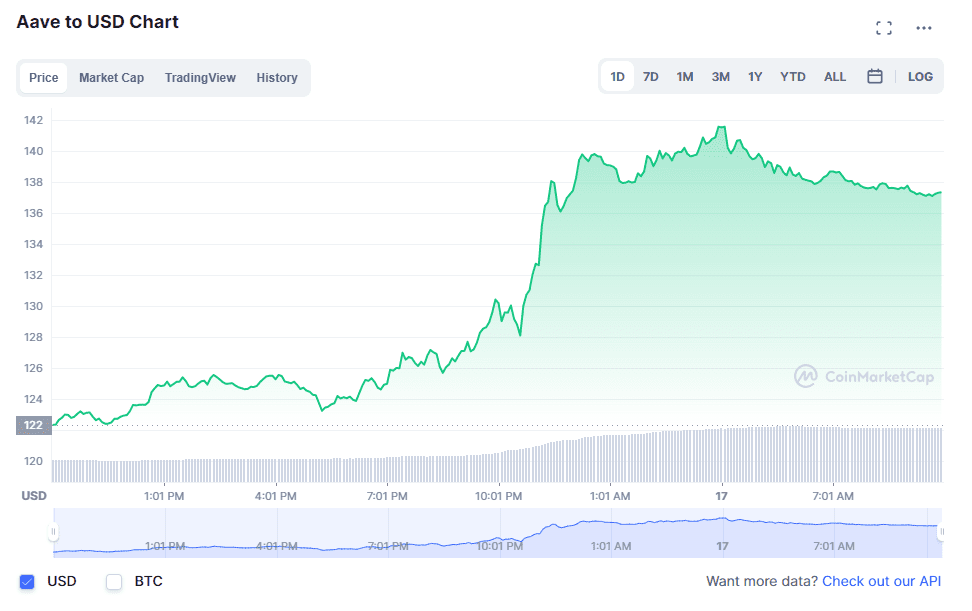
Yerevan (CoinChpater.com) – Aave borrowing and lending protocol declined by almost 12 percent since it peaked at $340 on August 1.
The cryptocurrency traded at $318 in the European session Wednesday, after bottoming at $300 earlier in the day. Meanwhile, the trading volumes of the token have declined during the past few days.
Data fetched by CryptoQuant analytical platform showed declines in AAVE’s inflow into exchanges, unlike other small cryptos, such as COMP, UMA, and MKR. The drop in exchange inflow indicates that traders are more willing to hold the asset than swap it for other cryptocurrencies/fiat money.
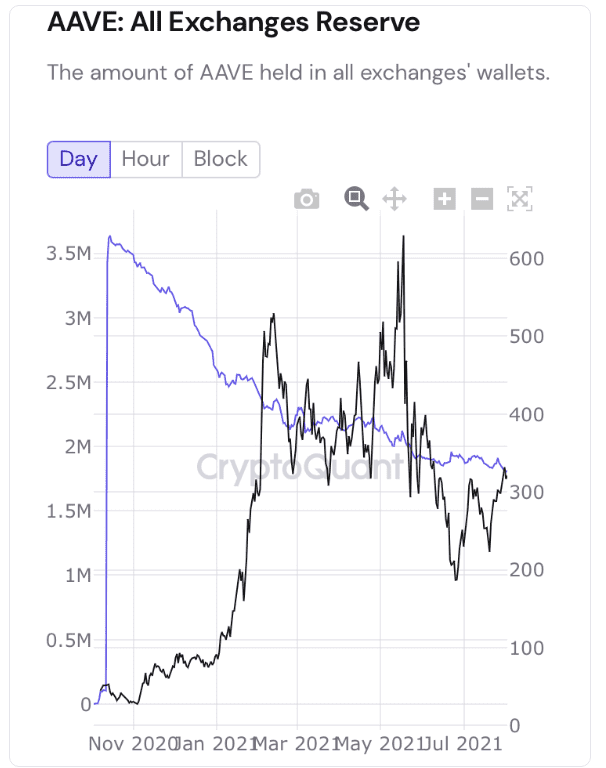
The accumulation of an asset usually indicates an upcoming price increase, as there are fewer coins left in liquidity pools available for trade. The scarcity of supply creates an uptrend and subsequently a higher demand. Therefore, a declining exchange flow can constitute a bullish hint for Aave.
Also read: Aave hints at invalidating bearish triangle structure, eyes 25% run-up.
AAVE daily chart
While the exchange supply declines, the price doesn’t look confident. Since mid-June, the token has been trading in an ascending triangle. The horizontal trendline of the triangle capped the bullish attempts, while the ascending bottom trendline capped downtrends.
The trendlines enclose the price action, gradually reducing its amplitude. Finally, the ascending triangle is a continuation pattern. As it occurred in a downtrend, the pattern suggests continuing the bearish price action after it’s exhausted.
However, there are bullish hints of the daily chart as well. For example, AAVE has traded above its 20-day exponential moving average (EMA-20; blue wave on the chart above). Moreover, the EMA-20 formed a golden cross with the 50-day simple moving average (SMA-50; red wave).
In hindsight, the golden cross occurs when a short-term MA moves above a long-term MA and promises further gains as long as the former can hold the dominant position.
Once AAVE retested the resistance trendline, it declined only to seek support from the EMA-20. If the assistance proves effective, the token could bounce off the wave and even break out of the pattern in a bullish action.
Also read: LUNA hits a 3-month high after Terra enables the Ethereum staking option.
What to expect?
At the moment, the signs look conflicting for AAVE, as there are both bullish and bearish hints. However, the bulls might win, as traders’ declining exchange inflow and holding behavior could easily overpower the vague bearish patterns on the daily chart.
Also read: Bitcoin boomed better as inflation hedge than real estate and gold: Pomp.

… [Trackback]
[…] Read More here to that Topic: coinchapter.com/aave-accumulation-ascends-during-11-77-decline-bull-run-ahead/ […]
… [Trackback]
[…] Here you can find 72972 additional Information to that Topic: coinchapter.com/aave-accumulation-ascends-during-11-77-decline-bull-run-ahead/ […]
… [Trackback]
[…] There you can find 64818 additional Information to that Topic: coinchapter.com/aave-accumulation-ascends-during-11-77-decline-bull-run-ahead/ […]