

NEW DELHI (CoinChapter.com) — Bitcoin prices have formed a rare chart signal that has historically been bad news for BTC price action. Twitter-based trader and analyst Nunya Bizniz highlighted a warning sign on BTC’s weekly charts.
The warning comes from two key moving averages of BTC. Bitcoin’s 20-week MA and 50-week MA have started to slope downwards. Historically, this is only the third time the MA trendlines have formed the pattern.
The last two times the pattern occurred- in late 2014 and 2018 – Bitcoin prices dipped by more than 50%. Furthermore, both times the signal occurred at almost similar points in the Bitcoin halving cycles.
Also Read: MicroStrategy will offer its employees an option to invest in Bitcoin (BTC) for their 401K savings plan.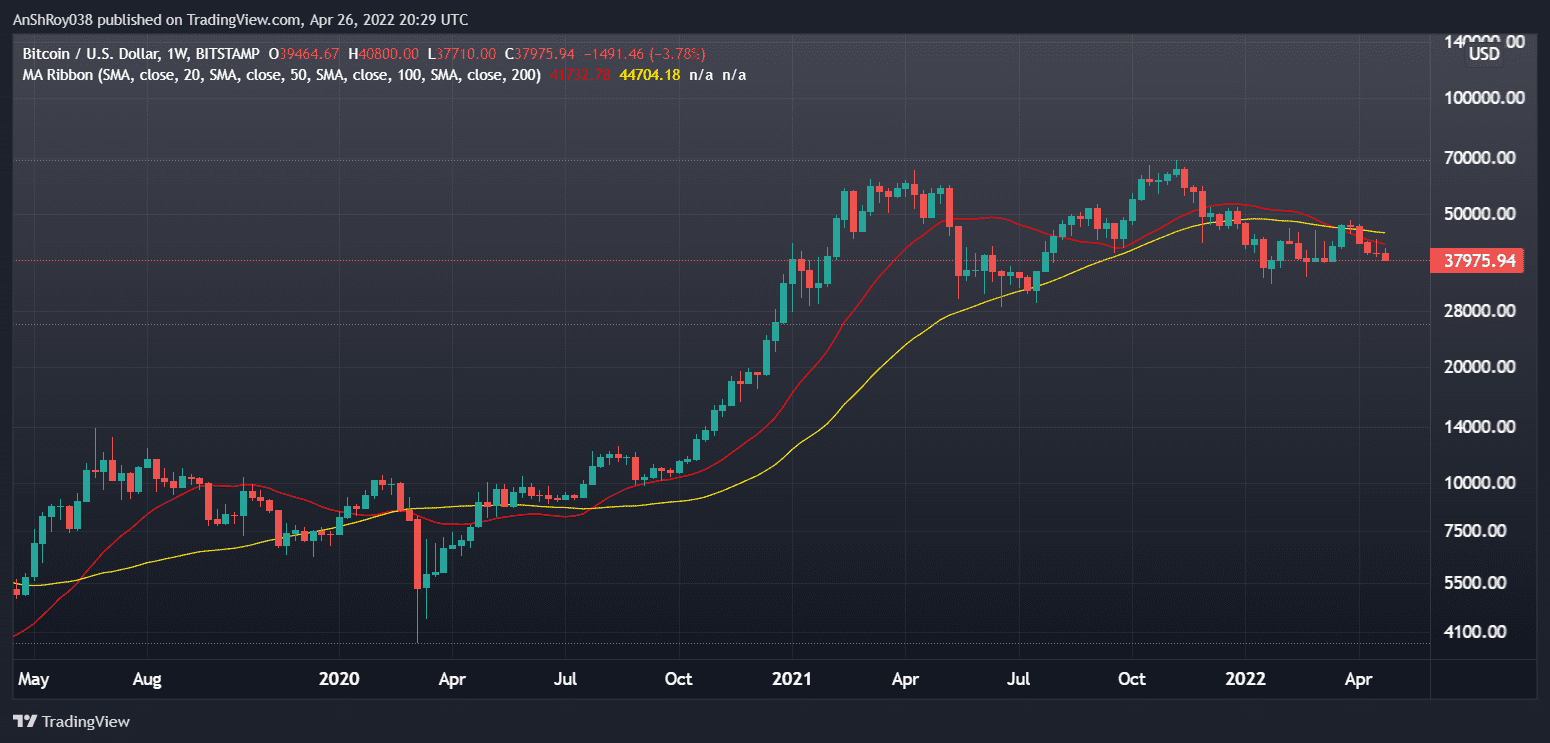
Bitcoin’s 20-week moving average (red wave) moved below its 50-week MA (yellow wave) in mid-Mar, charting a bearish pattern called the death cross.
The analyst predicts BTC prices could take six months to recover from the dip if the chart’s prediction holds.
Bitcoin Price Chart
BTC prices formed a death cross on their daily charts as BTC’s 20-day moving average (red wave) moved below its 100-day MA (purple wave). Traders often consider the pattern an indicator of negative market sentiment, and BTC prices reacted in a textbook manner.
BTC prices fell below $40,000 barely 24-hours after closing above the key resistance level on Apr 26. If the downtrend continues, Bitcoin prices could move to immediate support near $37,500, a price level that has supported Bitcoin price action since Feb 4.
If BTC breaks below immediate support, the token could fall to $35,500. Finally, Bitcoin price has support near $34,300, which BTC last visited on Feb 24.
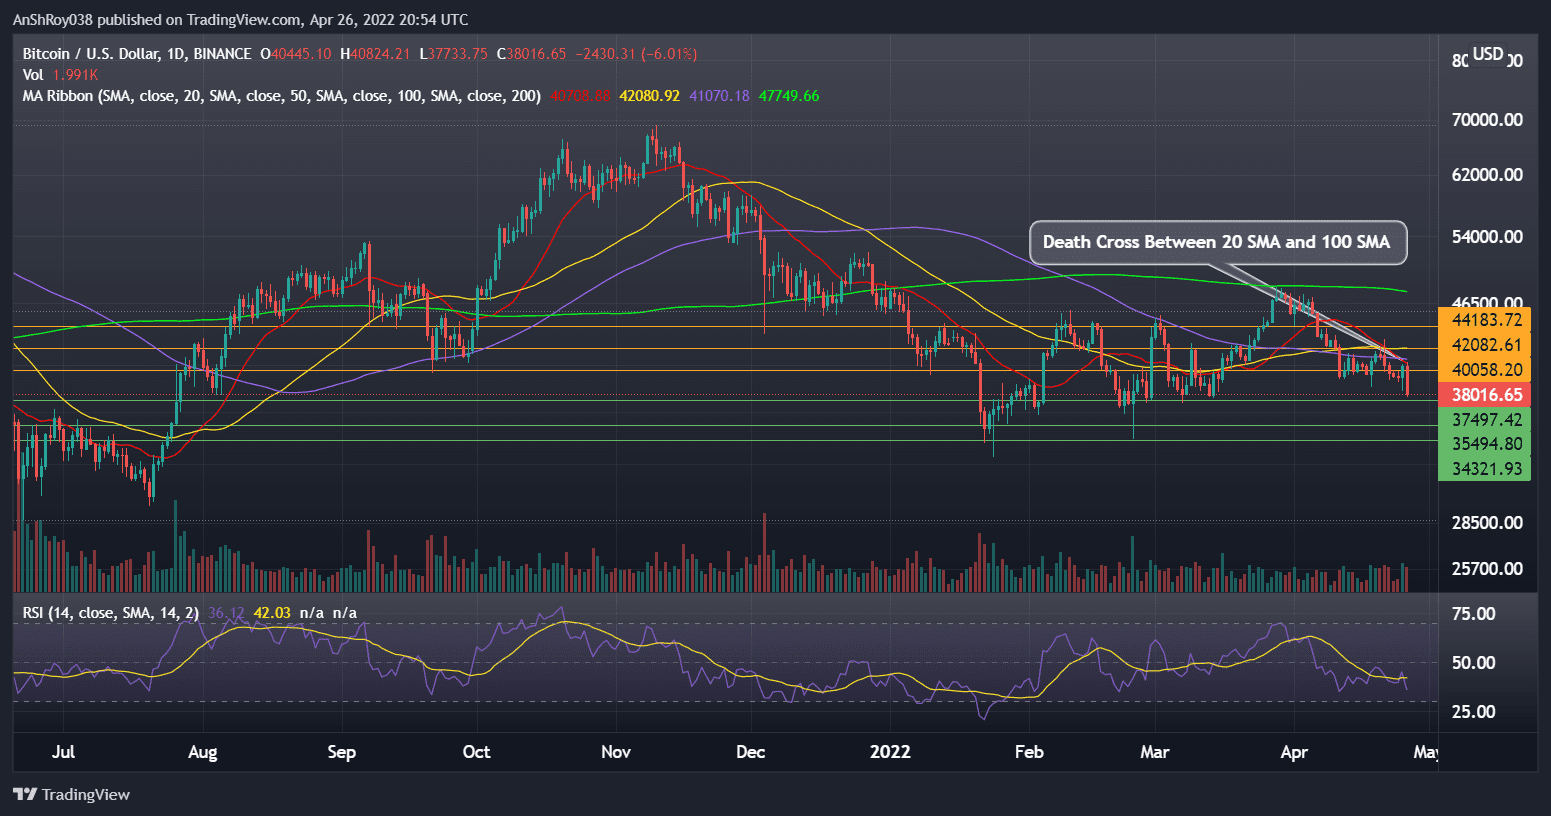
Meanwhile, Bitcoin’s relative strength index is currently neutral, clocking at 36.42 on the daily charts. However, the RSI trendline is moving down towards oversold levels. Traders often consider an oversold RSI level as an indicator of a trend reversal in favor of the bulls.
Also Read: The Central African Republic adopts Bitcoin as legal tender while BTC price drops below $40K.If BTC prices manage to start an uptrend, Bitcoin would need to move above immediate resistance near $40,000 to instigate positive sentiment in traders.
Additionally, if BTC prices flip immediate resistance and consolidate, traders would try to push Bitcoin above its 100-day MA (purple wave) to challenge resistance from its 50-day MA (yellow wave) near $42,000.
Finally, a sustained uptrend might result in Bitcoin prices challenging resistance near $44,200 before prices retreat.
At the time of writing, BTC was trading at $38,225, down 5.5% on the day.

… [Trackback]
[…] Read More Info here on that Topic: coinchapter.com/bitcoin-paints-chart-signal-that-forecasts-50-dip-analyst-asserts/ […]
… [Trackback]
[…] There you can find 14716 more Info on that Topic: coinchapter.com/bitcoin-paints-chart-signal-that-forecasts-50-dip-analyst-asserts/ […]