

NAIROBI (CoinChapter.com) — Bitcoin’s recent price action has shown significant clustering near the $71,600 mark, hinting at a possible downturn in its trajectory. According to insights from Rekt Capital, these clusters often foreshadow downward movements into lower price ranges.

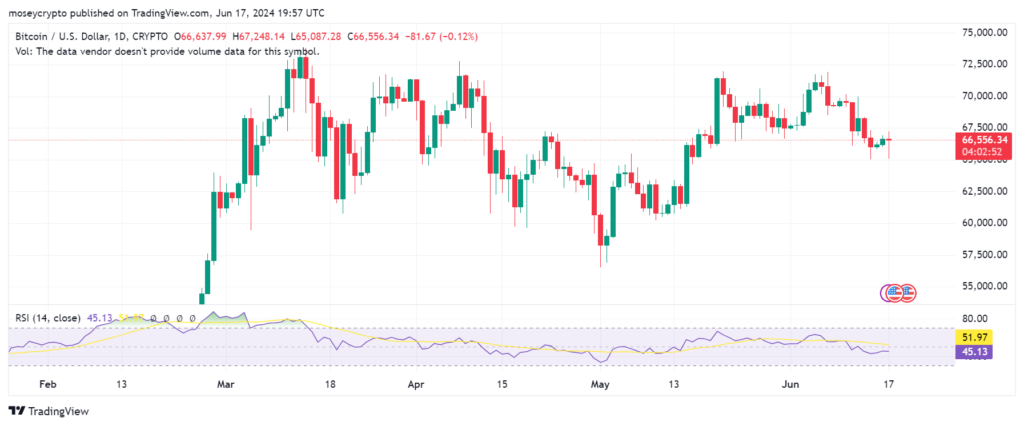
Rekt Capital highlighted that Bitcoin’s consolidation around the $71,600 resistance level has typically preceded corrections. This observation comes amidst Bitcoin’s current trading at approximately $67,054, reflecting a 5.7% weekly decline based on data from Bitstamp.
Potential Correction Below $64,000 Before Bullish Momentum Resumes
While Bitcoin has already tested support levels near $64,000, as noted by Rekt Capital regarding the Daily CME Gaps, further correction may be necessary. This correction phase could pave the way for Bitcoin to enter what analysts describe as the “parabolic phase” of its ongoing bull cycle.

On a more cautious note, Titan of Crypto highlighted in a recent social media update on June 16th that technical formations on higher timeframes, such as the monthly chart, suggest potential declines below $60,000. Titan’s analysis underscores the significance of these higher timeframes in assessing Bitcoin’s price movements, citing $58,800 as a critical level to monitor by early July.
Bitcoin Technical Indicators and Market Sentiment
Bitcoin’s Relative Strength Index (RSI), a key momentum indicator, currently stands at 41 as of June 17th. This indicates that Bitcoin’s price is hovering around fair value, although it previously dipped to 33 during the last major correction in early May, coinciding with a price drop to $56,600 before a swift recovery.
Additionally, market insights from Coinglass highlight robust support around the $64,500 mark, indicating potential liquidation of leveraged long positions if breached. Conversely, short-term Bitcoin holders (STHs), defined as those holding the asset for up to 155 days, show a realized price of around $62,200. This signifies significant support among speculative traders, potentially bolstering Bitcoin’s price stability amid market volatility.
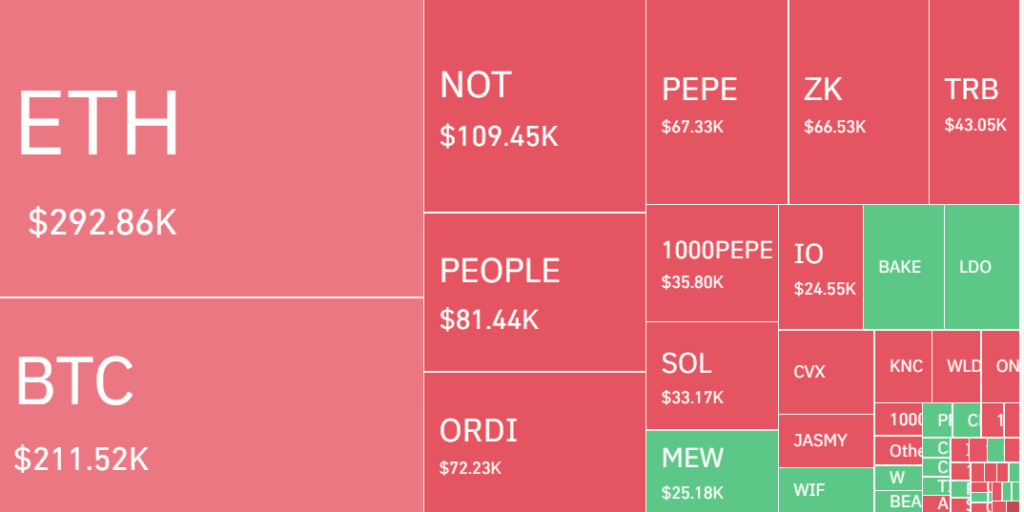
Centralized exchanges have seen notable liquidation events, with Binance leading at $4.21 million, accounting for over half of the total liquidations in a single day. Other platforms like OKX, Bybit, and Huobi Global (now HTX) also recorded substantial losses, totaling $29.63 million, $8.17 million, and $5.83 million, respectively.
Since early June, centralized exchanges have experienced ongoing liquidation activities, with losses reaching $400 million by June 7th and approximately $190.97 million last week alone.

