
Key Takeaways:
- Bitcoin is showing bearish signs from the $72,000 resistance.
- BTC/USD is following a declining channel with resistance at $66,250 on the daily chart.
- The price settled below the 50-day simple moving average (blue) to enter a bearish zone.

NEW DELHI (CoinChapter.com) — Bitcoin price is signaling a downside break below $66,000. BTC could extend losses and revisit the $60,300 support zone.
Bitcoin Price Dips Again
In the previous analysis, we discussed how Bitcoin price failed again to clear the $72,000 resistance zone. BTC formed a double-top pattern near the $72,000 resistance and started another decline. There was a move below the $70,000 and $68,500 support levels.
There was a move below the 23.6% Fib retracement level of the main move from the $56,712 swing low to the $71,922 high. In the past 3-4 days, the bulls struggled and failed to protect the key support at $66,500.
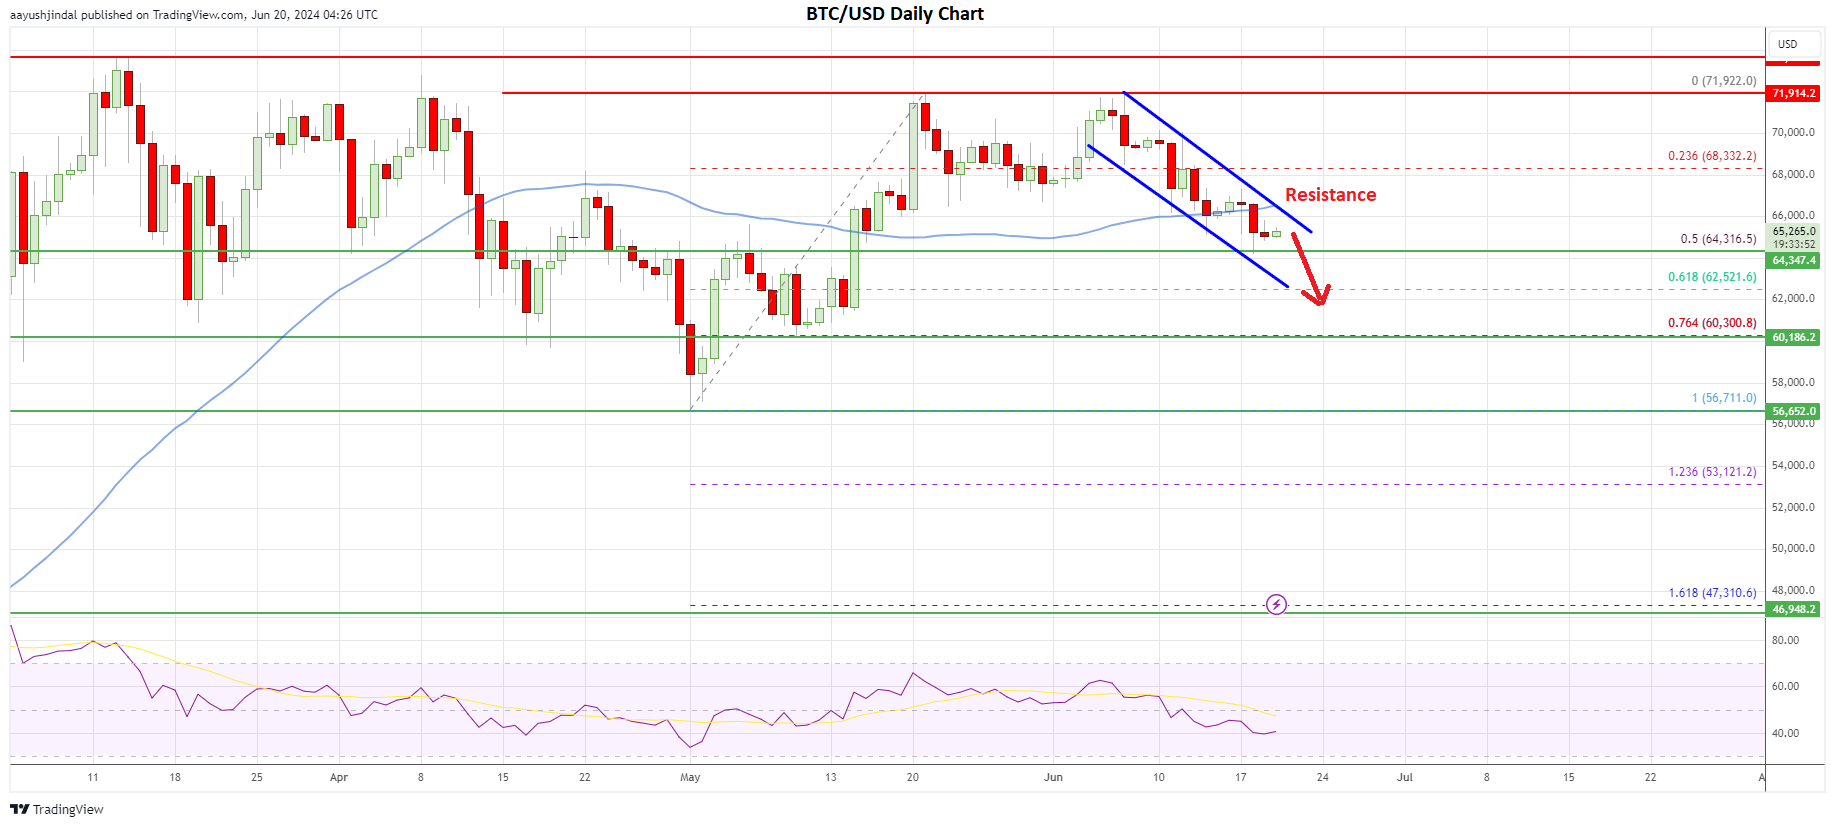
Bitcoin price settled below the 50-day simple moving average (blue) to enter a short-term bearish zone. It also follows a declining channel with resistance at $66,250 on the daily chart. More importantly, BTC struggled while Ethereum remained stable and recovered after the SEC closed its investigation on ETH as a security.
These are bearish factors and suggest a high chance of more downsides below $65,000. The first major support is near the $64,300 level. It is close to the 50% Fib retracement level of the main move from the $56,712 swing low to the $71,922 high.
If the bulls fail to protect the $64,300 support, there could be a larger decline. In the stated case, the price might decline toward the $60,300 support. Intermediate support sits near the $62,520 level.
Recovery Attempt by BTC?
Conversely, Bitcoin could stay above $64,300 and attempt a fresh increase. Immediate resistance on the upside sits at the $66,250 zone and the channel trend line. The first major resistance is now forming near the $67,200 zone. If BTC price breaks the $67,200 resistance, it could initiate a decent increase.
The next key resistance is $68,500, above which the price could gain bullish momentum. In the stated case, the bulls could even aim to move toward the $70,000 region. Any more gains might send the price toward the main hurdle at $72,000.
Overall, Bitcoin is signaling a downside break below $66,000 and the 50-day SMA. BTC is now at risk of more losses below the $65,000 and $64,300 support levels in the coming days.

