
NEW DELHI (CoinChapter.com) — Bitcoin (BTC) prices sunk to $19,281 on Jul 5 as the U.S. dollar started strengthening, trading at a 20-year high.
The USD index also rose above previous breakouts from Q2 this year. In addition, the Euro hit record levels of $1.033. Euro last rose to such levels in 2002-2003. The U.S. dollar’s rise, combined with the fall in yields, indicated that investors favor safer options instead of riskier assets like Bitcoin.
Analysts seem to be waiting for the dollar rally to subside to relieve the pressure on crypto markets. Moreover, the dollar’s rise also impacted gold and the U.S. equities market.
Meanwhile, Bitcoin prices have formed a bearish pattern called the bear flag, which might add to the selling pressure against BTC.
Also Read: Bitcoin could offer interim bullish opportunities as BTC holds key supportIn detail, the pattern forms when a cryptocurrency’s prices chart a sharp countertrend (the flag) after a short-lived trend. Flag patterns usually indicate a reversal of the countertrend. In addition, in a bearish pattern, volume might not always decline during consolidation.
Since an uptrend marks the consolidation period after a sharp downtrend, investors move in due to FUD from the price fall. Hence, higher than average volumes often accompany the consolidation period.
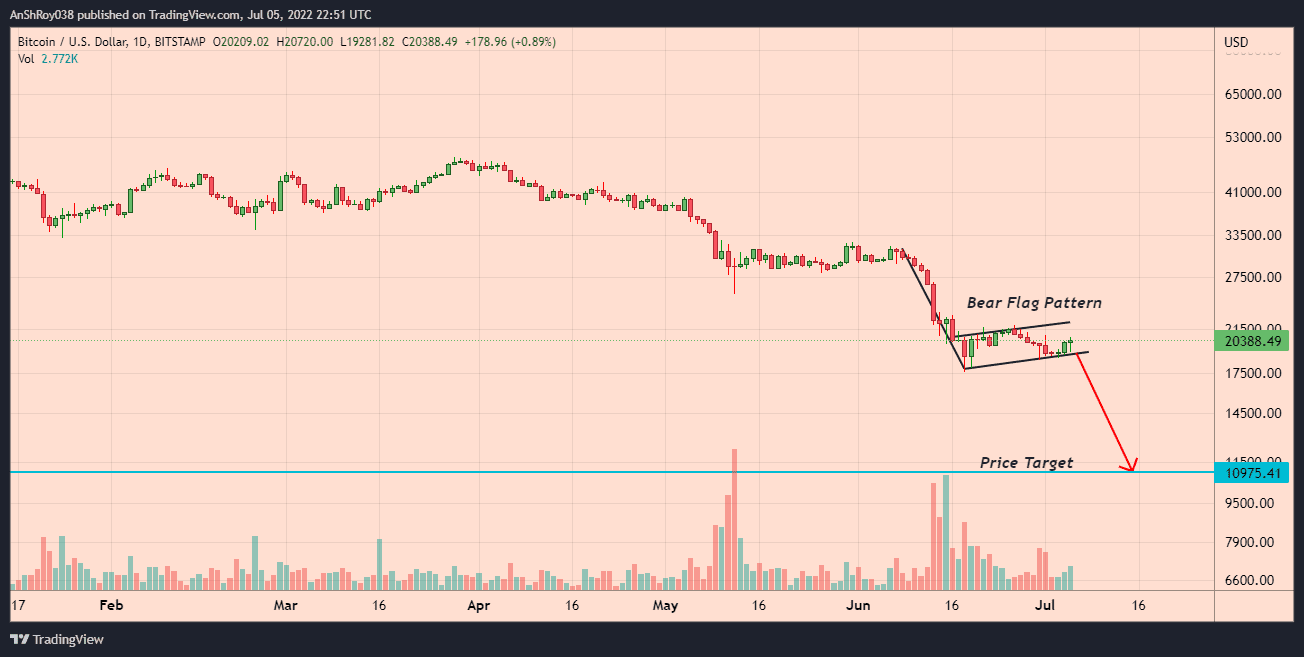
Traders calculate the bear flag pattern’s price target by subtracting the flagpole’s length from the breakout price level. As a result, BTC prices might fall to $10,975, a drop of more than 46% from current levels.
However, the long wick on the day’s daily candle indicated bulls are aggressively buying the prices dips. BTC prices closed Jul 5 down 0.2% on the day as bears moved to profit from Jul 4’s rally.
Bitcoin’s RSI Moving Towards Oversold Region
Bitcoin’s relative strength index has been trading below 50 since Apr this year, except for a few odd spikes, indicating strong selling pressure on the prime crypto. The token’s RSI entered neutral regions on Jul 4 after being oversold for three days.
At present, BTC’s RSI is neutral, with a value of 35.97 on the daily timeframe. RSI measures the magnitude of recent price changes to analyze overbought or oversold conditions. Traders often consider oversold RSI values as a buy signal.
Also Read: El Salvador buys $1.5M Bitcoin during the BTC price crash, president Nayib Bukele confirms.If bulls try to push prices upwards, Bitcoin prices would first need to conquer resistance from their 20-day exponential moving average (20-day EMA, red wave) near $21,200. Moreover, moving above its 20-day EMA might give BTC the momentum to challenge resistance near $23,000 before corrections pare gains.
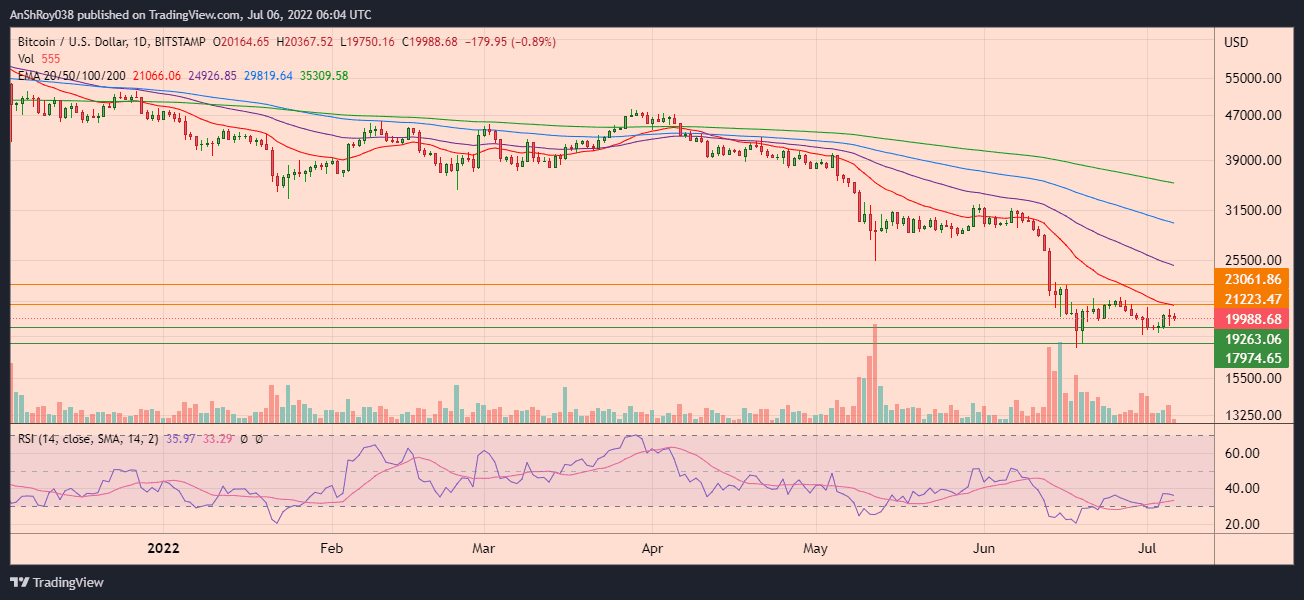
On the other hand, Bitcoin has struggled to hold its position above $20,000, as a sell-off ensued as soon as trading began on Jul 6. On Wednesday, Bitcoin prices dropped nearly 3% between intraday high ($20,367) and low ($19,750) levels.
If the sell-off continues, BTC could test support near $19,260. However, a breach below immediate support could see Bitcoin prices retest support near $18,000.
At writing, BTC was trading $20,049, down 0.59% on the day.

… [Trackback]
[…] There you can find 72720 more Information on that Topic: coinchapter.com/bitcoin-prices-suffer-as-u-s-dollar-strength-intensifies/ […]
… [Trackback]
[…] Read More on that Topic: coinchapter.com/bitcoin-prices-suffer-as-u-s-dollar-strength-intensifies/ […]