NEW DELHI (CoinChapter.com) — Cardano’s native token ADA prices jumped nearly 10% between intraday low ($0.609) and high ($0.67) levels.
As per a Twitter-based crypto trader @Phoenix_Ash3s, ADA prices might reach $0.73 if Cardano pushes through after consolidating for a while at current levels.
The trader highlighted a similar upside movement for ADA in May this year, during which ADA prices consolidated near a support level before jumping upwards. Phoenix argues that the altcoin’s prices might repeat the pattern.
Also Read: Cardano pulls back as ADA fails to break out of bullish pattern.A move towards $0.73 would result in ADA prices breaking above the double top pattern’s neckline. CoinChapter.com earlier reported that Cardano prices failed to break out from a bullish technical pattern called the double bottom.
Resistance Confluence Continues To Plague ADA Price Action
ADA drew bullish tailwinds from a technical pattern called the double Doji pattern. In detail, a Doji is a candlestick that forms when a cryptocurrency’s price opens and closes close to the same level. Long wicks on both ends with a thin or negligible body identify the candlestick.
Analysts view a single Doji as a sign of conflict between bears and bulls. Furthermore, a Doji that appears during a downtrend might suggest sluggish bearish momentum for ADA.
In addition, ADA has jumped 18.5% between Jun 6’s low ($0.57) and Jun 8’s high ($0.67) after forming the double Doji candles on Jun 4 and 5.
Meanwhile, ADA’s price action struggled with a resistance confluence between a multi-week descending trendline and Cardano’s 50-day exponential moving average (50-day EMA, purple wave) near 0.66.
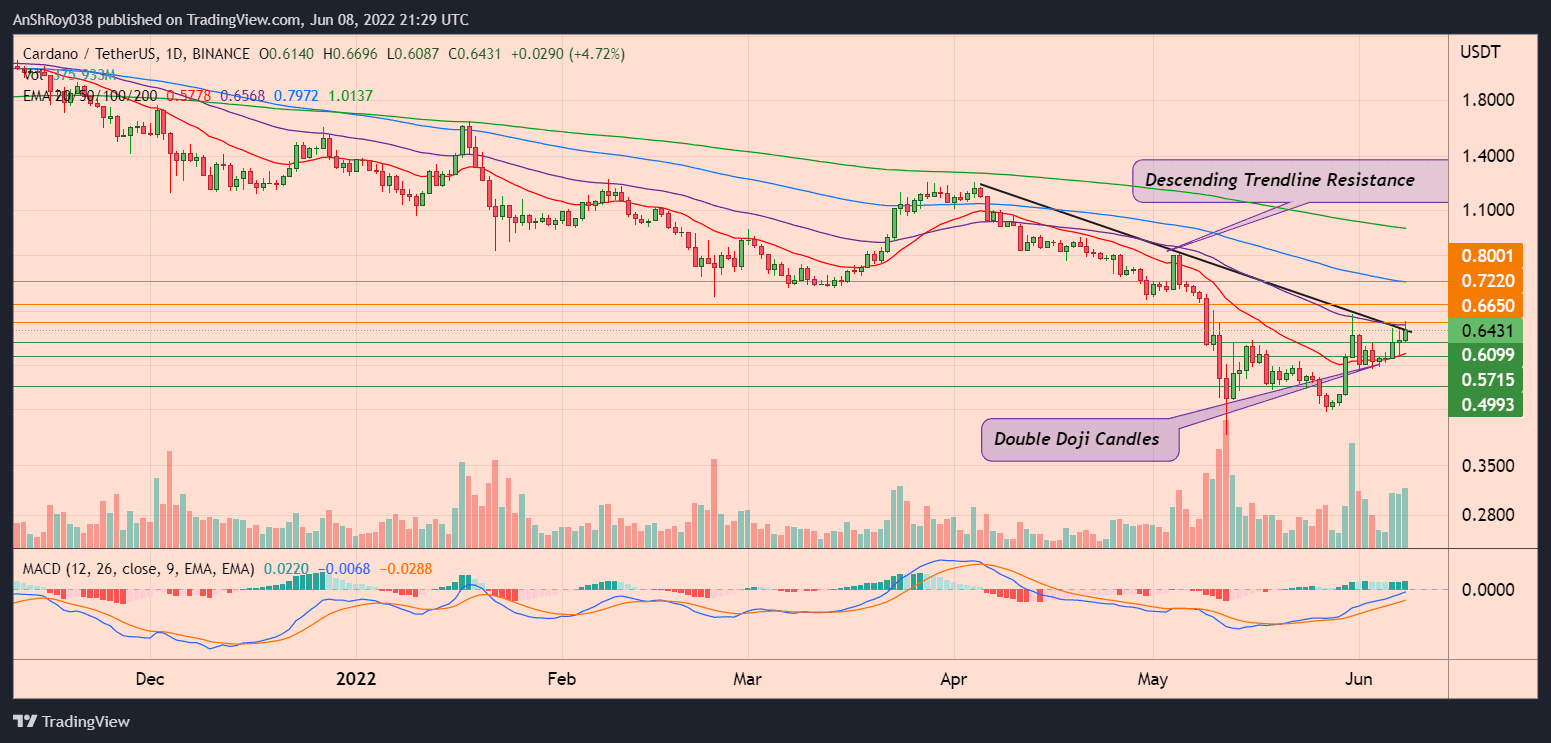
Moreover, the trend-based momentum oscillator MACD remains bullish for the XMR token. Positive bars on the MACD histogram have started contracting. Expanding bars indicate the MACD line (difference between 12-day and 26-day EMA) might be moving away from its signal line (9-day EMA of MACD).
Also Read: Cardano (ADA) soars over 50% in four days — a bull trap?Meanwhile, a move above ADA’s immediate resistance might provide Cardano the momentum to target resistance near $0.722. Finally, a sustained uptrend might help ADA prices challenge resistance at $0.8, near Cardano’s 100-day EMA (blue wave) before correction pare gains.
Conversely, a downtrend could see ADA prices test support near $0.61. In addition, a breach below its immediate resistance might push ADA prices to support from its 20-day MA (red wave) near $0.57. Finally, a marketwide sell-off would result in Cardano prices falling to support near $0.5.
At the time of writing, ADA was trading at $0.648, up 5.52% on the day.

… [Trackback]
[…] There you will find 59660 more Info on that Topic: coinchapter.com/cardano-eyes-relief-rally-as-ada-paints-a-double-doji-pattern/ […]
… [Trackback]
[…] Information to that Topic: coinchapter.com/cardano-eyes-relief-rally-as-ada-paints-a-double-doji-pattern/ […]
… [Trackback]
[…] Read More Information here on that Topic: coinchapter.com/cardano-eyes-relief-rally-as-ada-paints-a-double-doji-pattern/ […]
… [Trackback]
[…] Find More here on that Topic: coinchapter.com/cardano-eyes-relief-rally-as-ada-paints-a-double-doji-pattern/ […]
… [Trackback]
[…] Read More to that Topic: coinchapter.com/cardano-eyes-relief-rally-as-ada-paints-a-double-doji-pattern/ […]
… [Trackback]
[…] Information to that Topic: coinchapter.com/cardano-eyes-relief-rally-as-ada-paints-a-double-doji-pattern/ […]