
NEW DELHI (CoinChapter.com) — Cardano (ADA) failed to break out from a bullish technical pattern, indicating a lack of bullish sentiment among investors.
The altcoin’s price moved inside a bullish reversal pattern called the “double bottom.” In detail, the pattern forms when an asset’s prices drop, rebound, another drop to the same or similar level, and finally, another rebound. The pattern looks like the letter ‘W.’
As per the rules of technical analysis, the first bottom should be a drop of 10% to 20%. Then, the second bottom would need to form within 3% to 4% of the previous low. Therefore, traders consider the double-touched low as support.
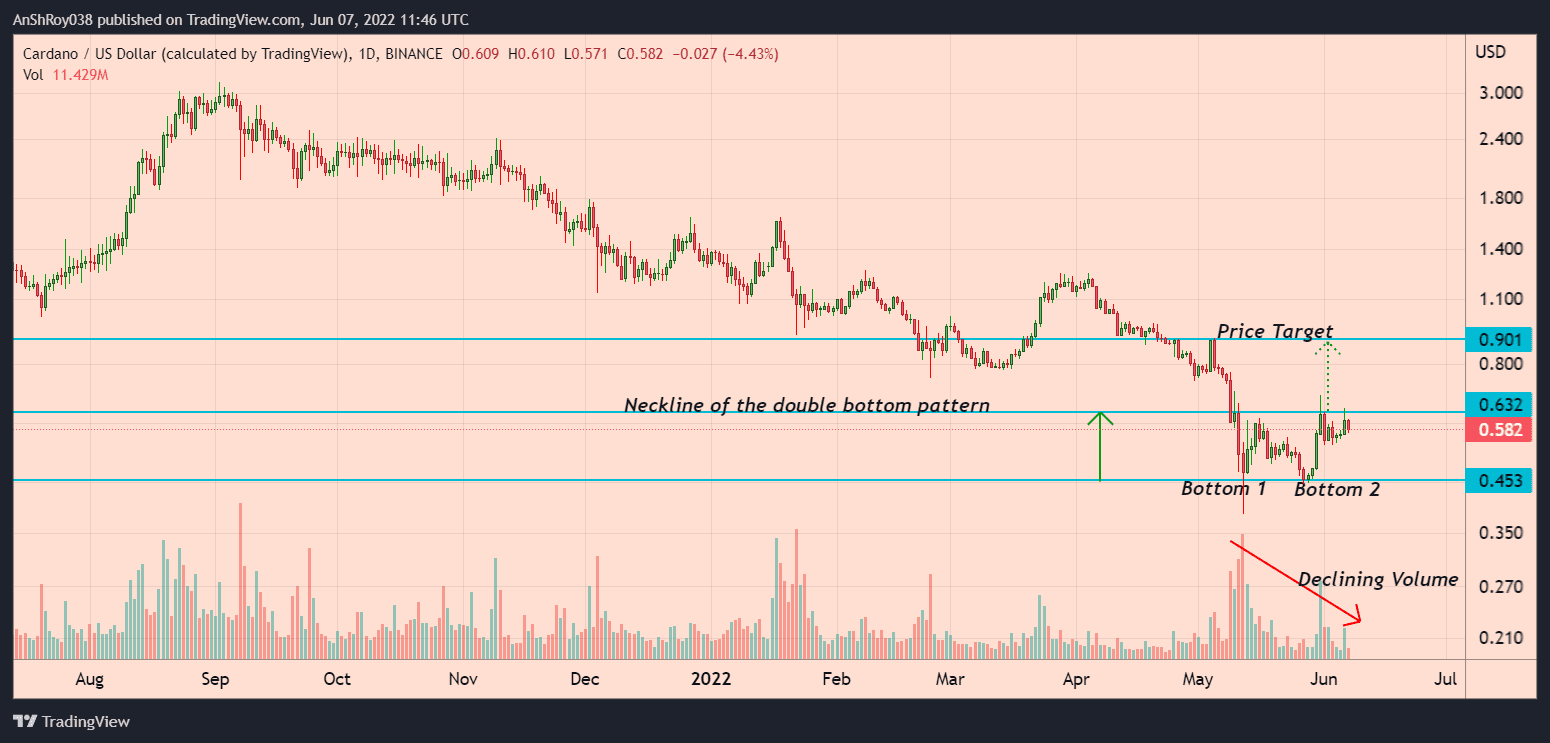
The distance between the bottom levels and the neckline gives the price target for a double bottom. Had Cardano prices broken out of the pattern, ADA would have had a price target of $0.9, a jump of nearly 55% from current prices.
Also Read: Cardano (ADA) soars over 50% in four days — a bull trap?However, ADA’s volumes declined while its prices formed the double bottom pattern. As a result, ADA prices pulled back from the neckline and moved between $0.63 and $0.55.
Resistance Confluence Might Trouble ADA Price Action
ADA prices’ range-bound movement continued on Jun 7, with Cardano falling nearly 6.4% between intraday high ($0.61) and low ($0.57) levels.
Meanwhile, ADA’s double bottom pattern’s neckline coincided with a resistance confluence between a multi-week descending trendline and Cardano’s 50-day exponential moving average (50-day EMA, purple wave) near 0.66.
The resistance confluence has rebuffed ADA price’s uptrend four times since Apr 2022. Hence, a move above ADA’s immediate resistance would likely provide Cardano the momentum to target resistance from its 100-day EMA (green wave) near $0.8.
Finally, a sustained uptrend could help ADA prices reach the psychologically vital $1 resistance, near Cardano’s 200-day EMA (blue wave) before correction pare gains.
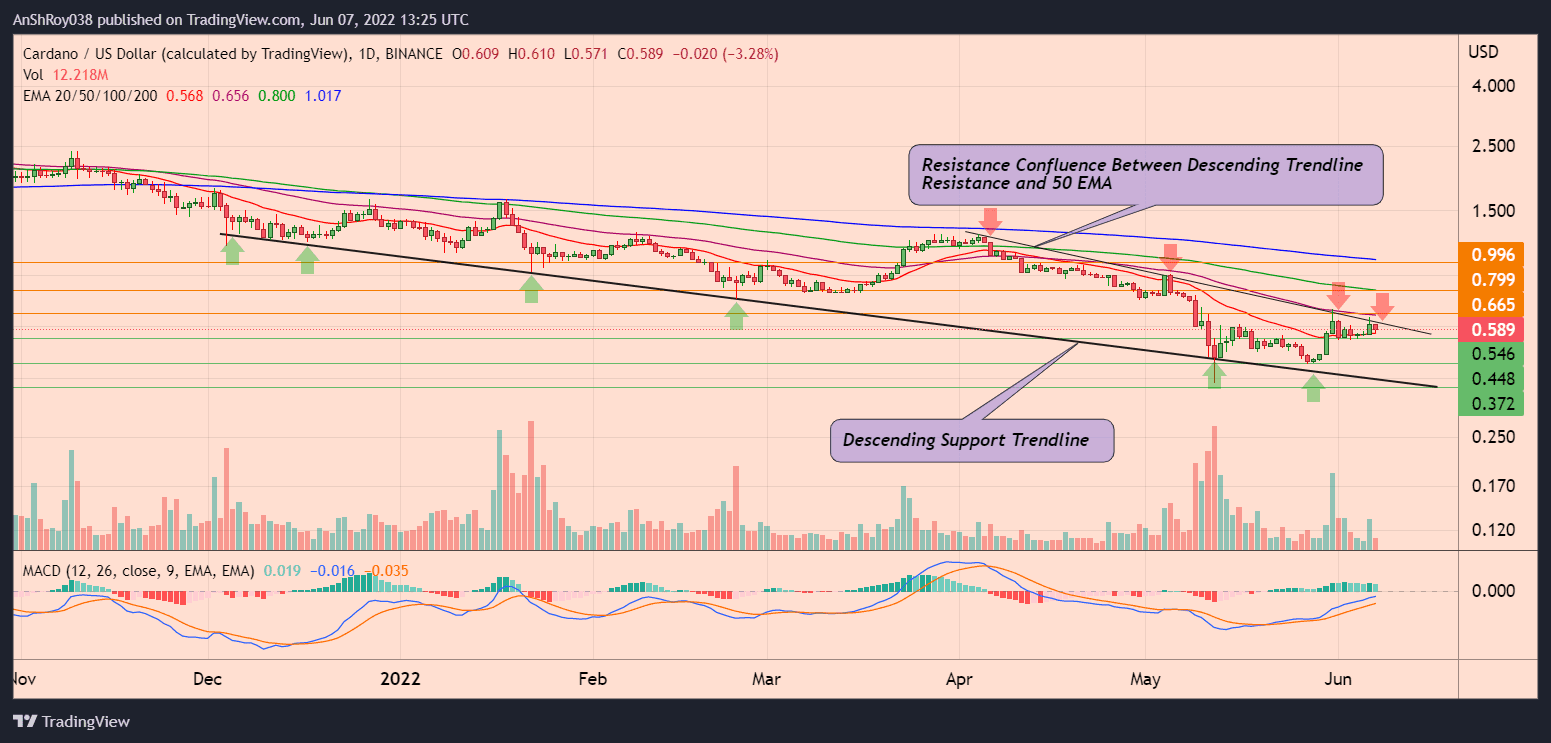
Moreover, the trend-based momentum oscillator MACD remains bullish for the XMR token. But, positive bars on the MACD histogram have started contracting.
Contracting bars indicate the MACD line (difference between 12-day and 26-day EMA) might be moving towards the MACD signal line (9-day EMA of MACD). The indicator might chart a bearish crossover between the MACD and signal lines.
Also Read: Massive Cardano breakout underway as ADA rises 17% in three days.ADA prices might test support near its 20-day EMA (red wave) at $0.55. Furthermore, a breach below immediate resistance could see ADA prices fall to $0.45.
Finally, ADA prices enjoy support from multi-month trendline support near $0.37. The trendline has previously supported ADA price action six times since Dec 2021.
At the time of writing, ADA was trading at $0.597, down 2.13% on the day.

… [Trackback]
[…] Information to that Topic: coinchapter.com/cardano-pulls-back-ada-fails-break-out-bullish-pattern/ […]
… [Trackback]
[…] Find More to that Topic: coinchapter.com/cardano-pulls-back-ada-fails-break-out-bullish-pattern/ […]
… [Trackback]
[…] Read More on that Topic: coinchapter.com/cardano-pulls-back-ada-fails-break-out-bullish-pattern/ […]
… [Trackback]
[…] Find More here to that Topic: coinchapter.com/cardano-pulls-back-ada-fails-break-out-bullish-pattern/ […]
… [Trackback]
[…] Here you can find 7793 additional Information to that Topic: coinchapter.com/cardano-pulls-back-ada-fails-break-out-bullish-pattern/ […]