

NEW DELHI (CoinChapter.com) — Cardano prices broke above the upper trendline of a falling wedge pattern on May 30. Two converging trendlines with a negative slope connecting swing highs and swing lows form the descending pattern.
Also Read: Cardano stumbles after weekend run sees ADA jump 30%.
Prices bounce between the converging trendlines until the asset breaks out. Then, high trading volumes confirm the breakout. The upside target for the breakout is equal to the maximum distance between the falling wedge’s upper and lower trendlines.
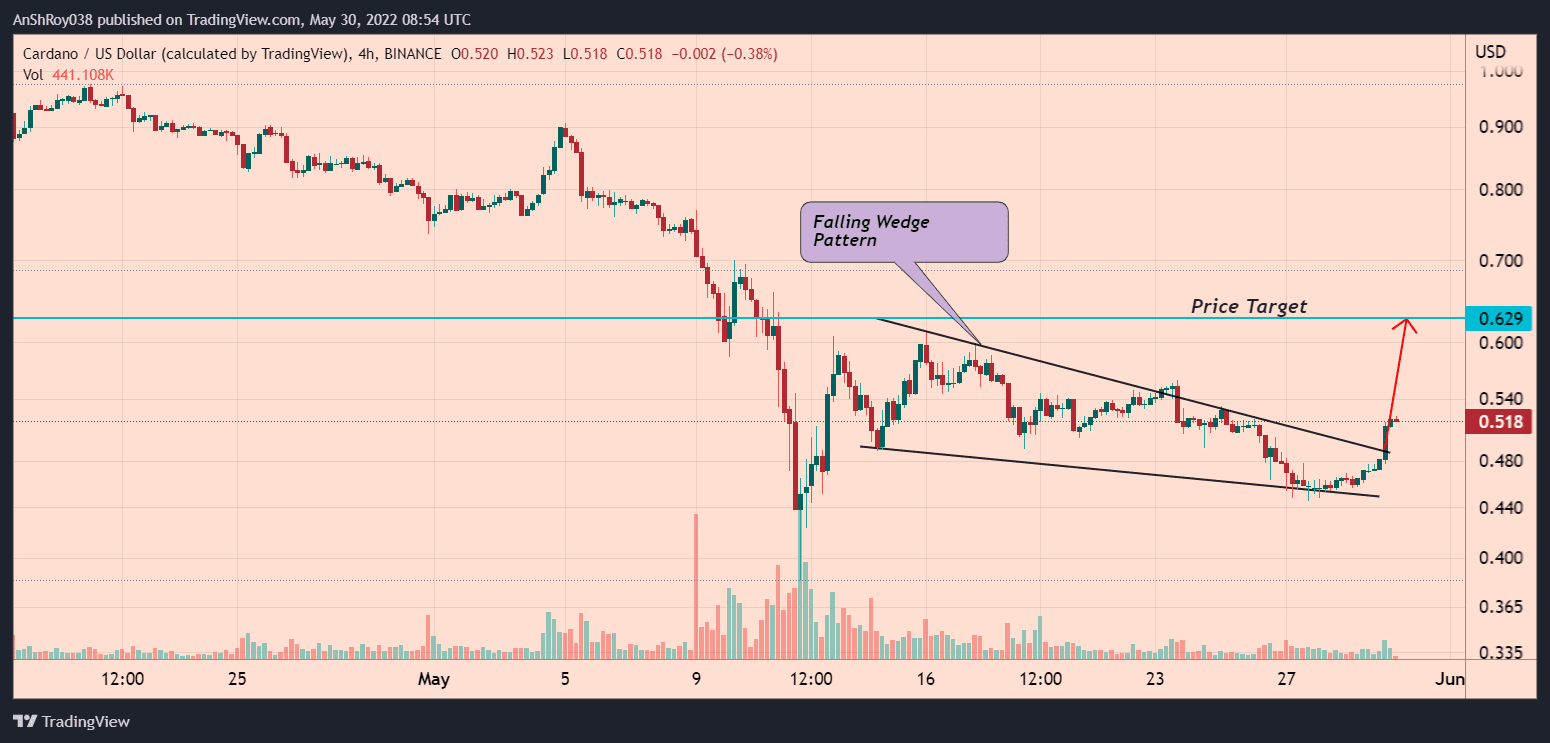
ADA’s breakout above the upper trendline puts the token on the path to a price target of $0.629, a jump of 21.4% from current prices. On the other hand, the falling wedge might not be a reliable indicator of the beginnings, as Tom Bulkowski, a veteran investor.
As per his research, an asset meets its breakout price target in only 62% of the cases. He highlighted that a downward breakout from a falling wedge in a bear market is more reliable.
Cardano RSI shows weakening selling pressure
ADA prices jumped 17% over the weekend, jumping from May 28’s low of $0.45 and reaching an intraday high of $0.523 on Monday.
The uptrend helped Cardano break above the falling wedge’s upper trendline. However, ADA’s gains seem to be part of a wider crypto market upswing than a reaction to the testnet launch.
Meanwhile, the altcoin’s relative strength index has risen since May 27. RSI measures the magnitude of recent price changes to analyze overbought or oversold conditions. At present, ADA’s RSI remains neutral, with a value of 42.2 on the daily charts.
Moreover, the rising RSI trendline suggests selling pressure is reducing for ADA. Cardano’s began its uptrend after rebounding off multi-month descending trendline support. The token has previously tested the support several times since Dec 2021.
As a result, ADA prices might continue their uptrend to challenge resistance from its 20-day moving average (red wave, 20-day MA) near $0.54.A move above the 20-day MA could help ADA gather momentum to target resistance near $0.624, near the falling wedge’s price target.
Also Read: Cardano (ADA) gains 20% in 24 hours – recovery or dead cat bounce?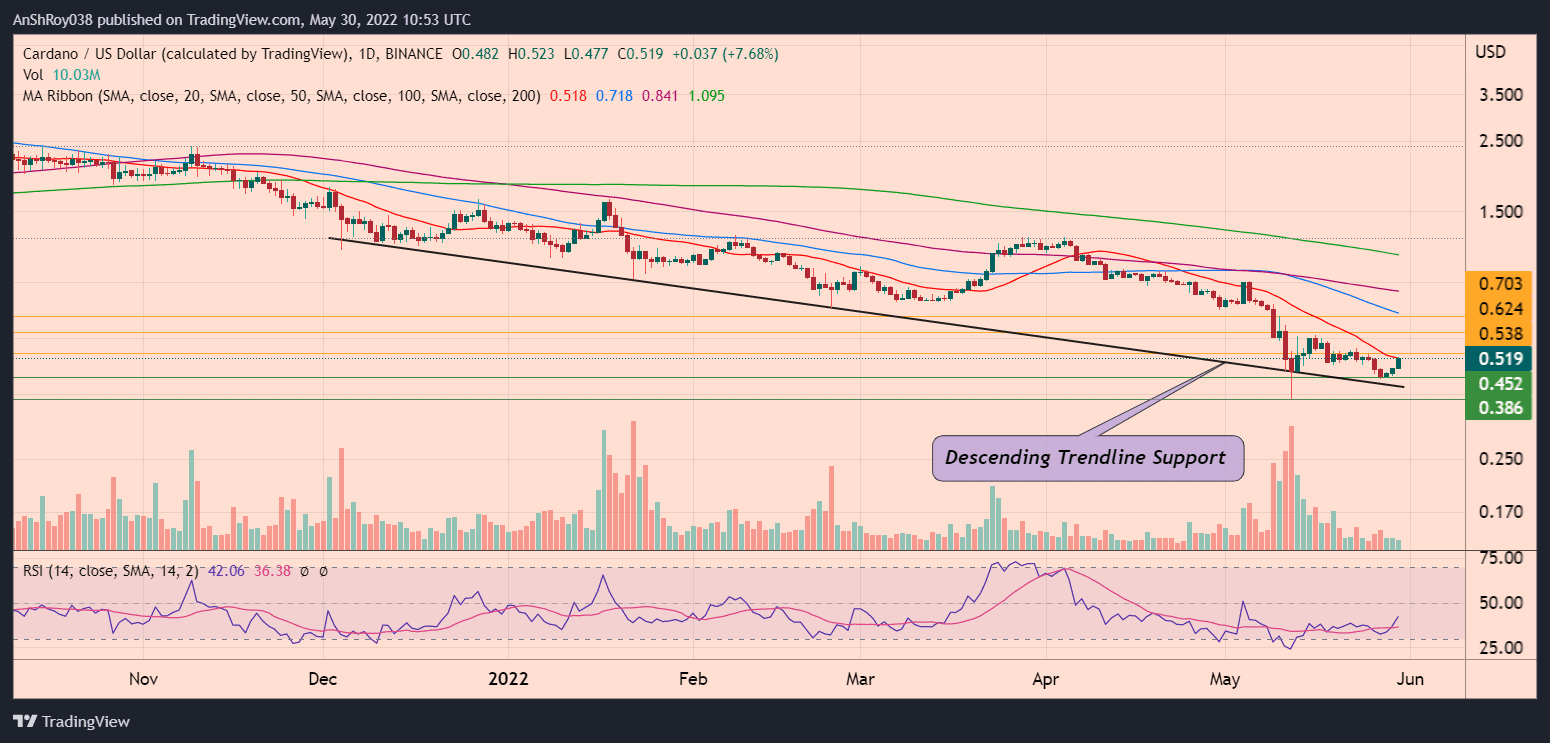
Finally, a sustained buying spree might see ADA prices reach $0.7, near Cardano’s 50-day MA (blue wave) before market corrections pare prices. On the other hand, if the 20-day MA resistance rebuffs ADA’s uptrend, the token could fall to support near $0.45.
A market-wide sell-off could see ADA test support near $0.39, its lowest since Feb 2021.
At the time of writing, ADA was trading at $0.52, up 7.68% on the day.

… [Trackback]
[…] Find More to that Topic: coinchapter.com/massive-cardano-breakout-underway-as-ada-rises-17-in-three-days/ […]
… [Trackback]
[…] Read More on that Topic: coinchapter.com/massive-cardano-breakout-underway-as-ada-rises-17-in-three-days/ […]