
Key Takeaways:
- Blockchain Oracle Network Chainlink’s in-house token LINK eyed a significant break, according to a technical setup.
- The Network adoption grew, with 17 new projects integrating Chainlink in the previous week.
YEREVAN (CoinChapter.com) — Chainlink (LINK) painted a Symmetrical Triangle on its weekly chart that has been instrumental since May 2021. CoinChapter described in the previous Chainlink review that the pattern does not entail a specific vector after LINK exhausts the setup. However, traders should still expect a significant move in Q1-Q2 2022.
The Symmetrical Triangle features a resistance trendline with a negative slope and a support trendline with a positive slope. The converging lines enclose the price action and gradually lower the swing amplitude.
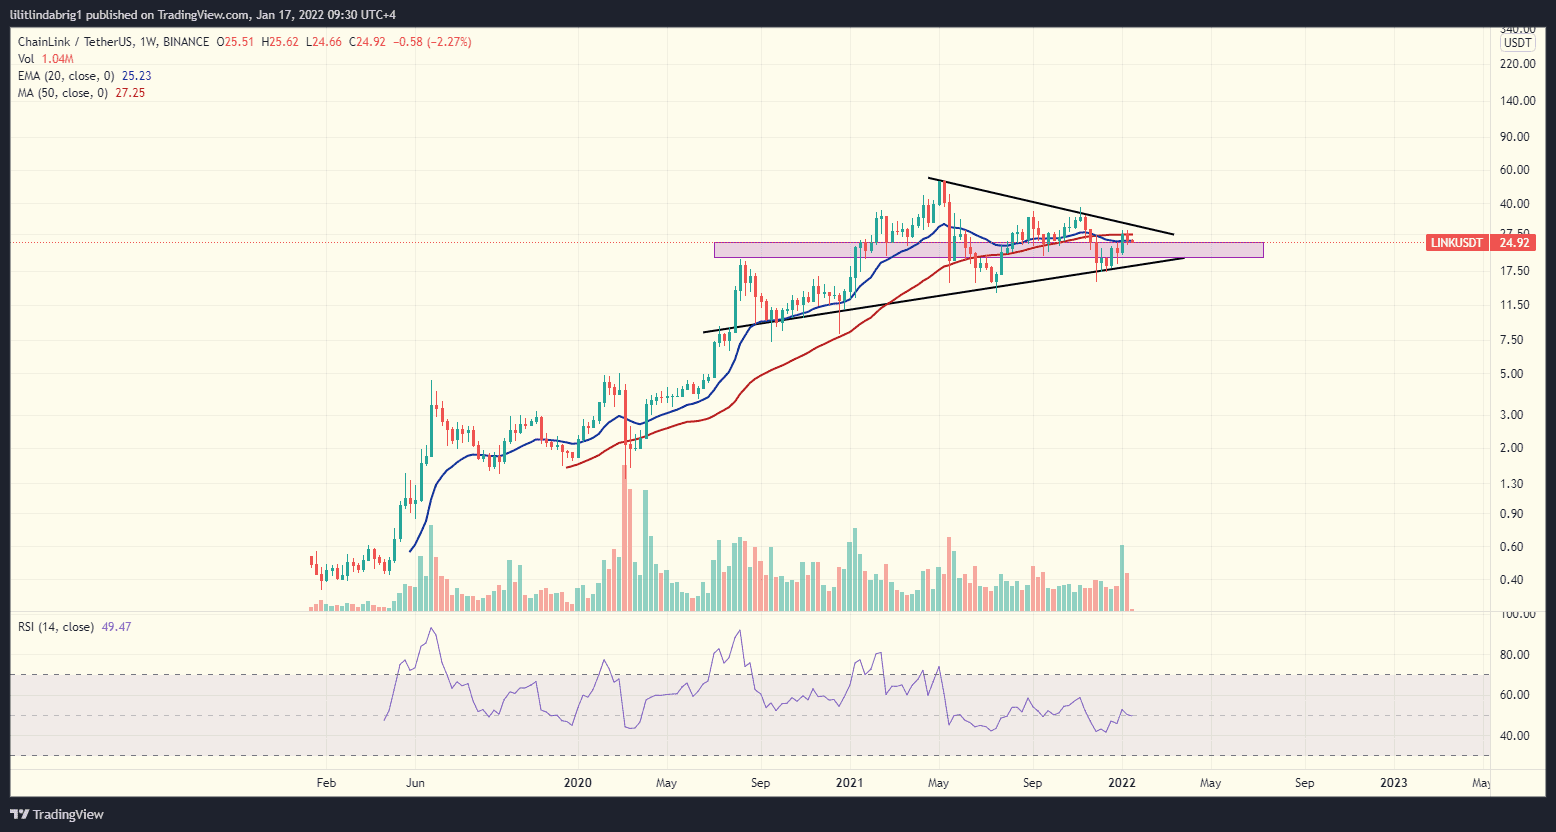
Also read: Chainlink ducks crypto market downtrend as LINK rises 36% in 2022—but is this rally sustainable?Additionally, LINK arrived at a significant rebound level to determine the token’s monthly results. The support lied at $24.9, and if the Chainlink token holds above the said level, it could break out of the Symmetrical Triangle setup. If not, a 23% drop to the Triangle support could be in the cards.
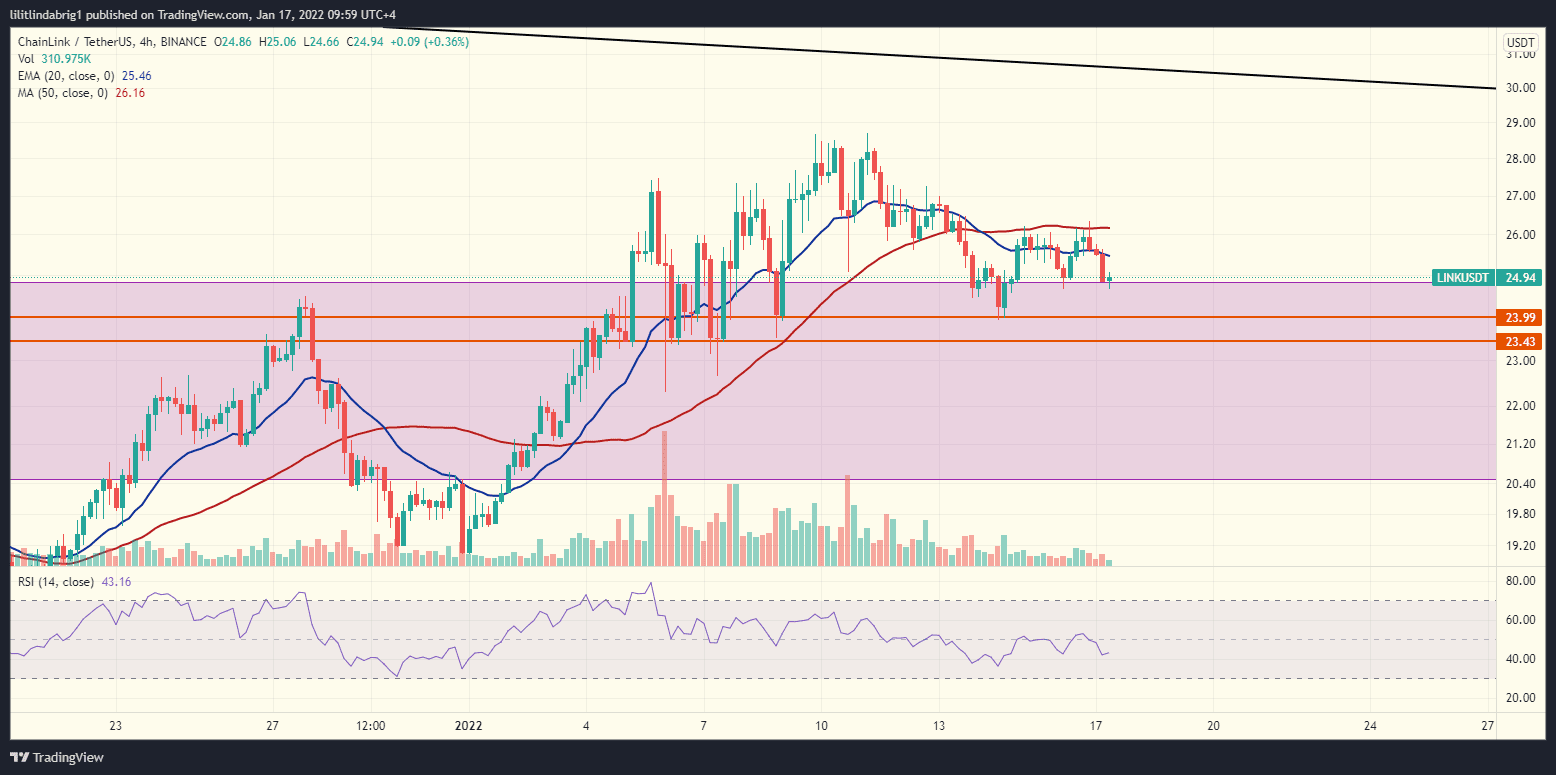
Lower timeframe indicators
The four-hour chart below best shows LINK’s indecisive attempts to break out. The token retested the said support bar several times in the previous week. Finally, on Jan 17, LINK changed hands at $25.1, barely above the indicated rebound level.
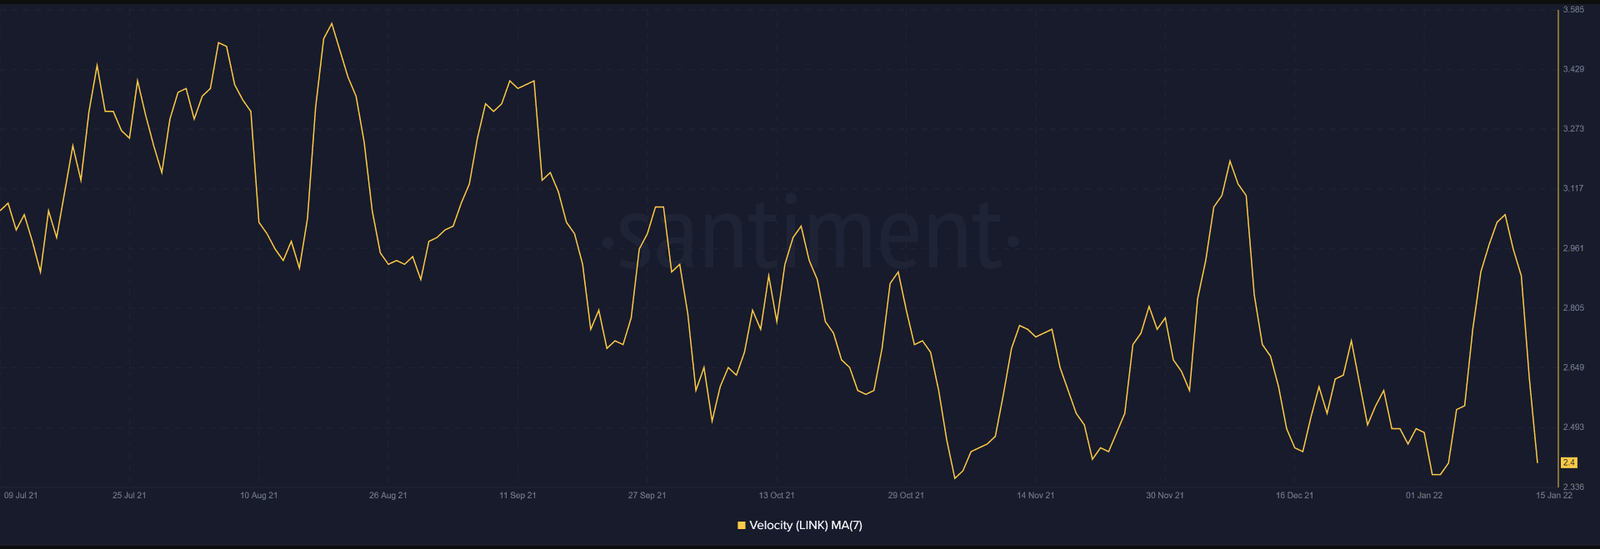
Moreover, other on-chain data suggests LINK could increase in value. According to crypto analytical platform Santiment, the token’s velocity has dropped significantly since Jan 7. In hindsight, an asset’s velocity is generally determined by the balance of money supply and economic activity.
A velocity decline could indicate a HODLing incentive among traders, which typically leads to a value increase.
Also read: Bitcoin gains institutional adoption in Brazil: Rio de Janeiro to invest 1% of reserves in crypto While the upcoming sessions will reveal LINK’s possible vector for the short-term, the Network’s adoption continued to grow, with more projects joining in the previous week.
Growing Chainlink adoption
As the company announced on Sunday, 17 new projects over seven blockchains adopted Chainlink in the previous week.
Moreover, Chainlink reported that it features over 700 pre-built oracle networks that have provided over a billion data points to decentralized applications (dApps) across several leading blockchains.
Also read: Chainlink whales capture 24.8% of the total LINK supply; is it risky?Chainlink’s growing adoption paints a bullish picture for the asset despite the indecisive technicals, as more blockchains and projects integrate the Oracle Network. However, the upcoming month will show if LINK can break out of the Symmetrical Triangle and ensure an uptrend. As of publication, a 20% decline is equally possible.

… [Trackback]
[…] Information on that Topic: coinchapter.com/chainlink-link-at-a-rebound-level-sustainable-growth-or-looming-decline/ […]
… [Trackback]
[…] Information on that Topic: coinchapter.com/chainlink-link-at-a-rebound-level-sustainable-growth-or-looming-decline/ […]