

NEW DELHI (CoinChapter.com) — The cryptocurrency market recovered slightly on Apr 21 as most cryptos continue to move laterally. The overall crypto market cap fell to $1.91 trillion, a decline of 0.68% in 24 hours, as per CoinMarketCap data.
Bitcoin rose above $42,000, riding on macro cues as the U.S. dollar currency index (DXY) fell sharply after reaching 101 on Apr 20. However, BTC couldn’t maintain its uptrend, likely due to its strong correlation with the S&P 500.
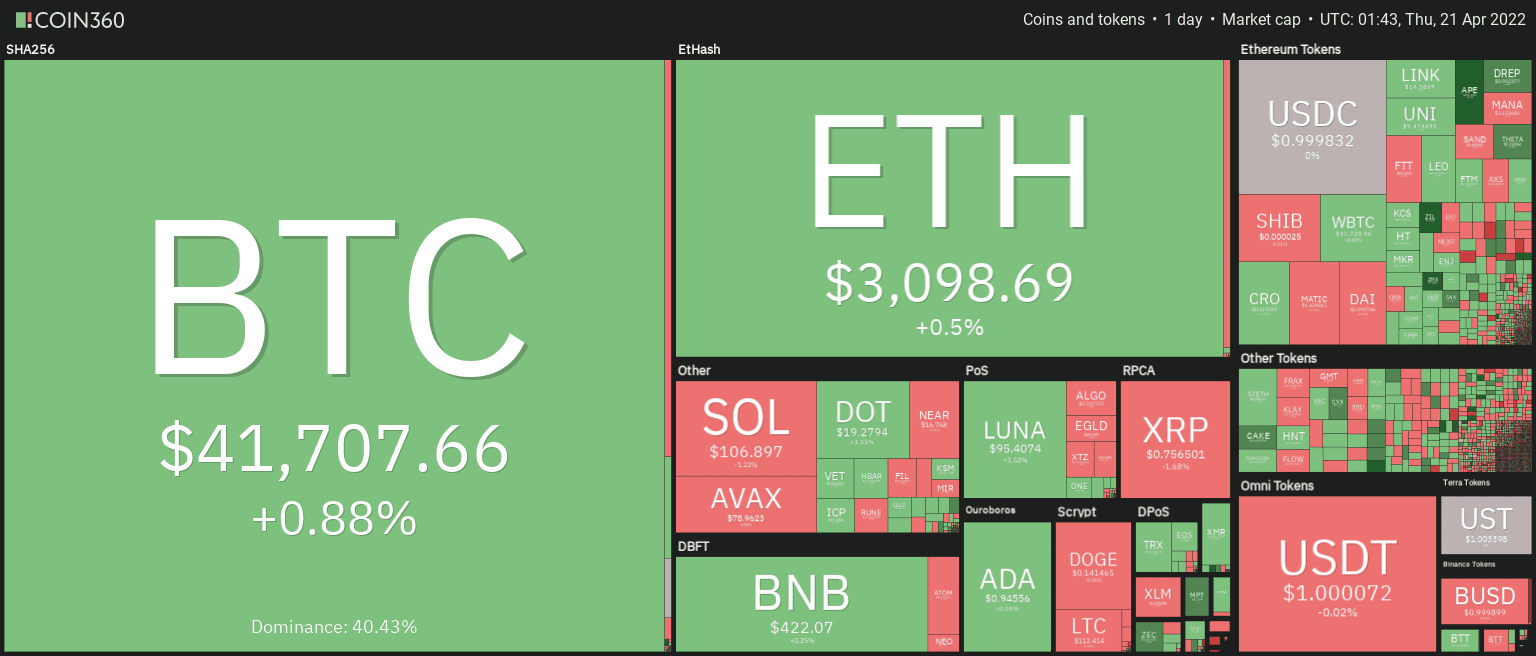
However, positive cues remain, such as a report by Insider Intelligence that predicts the number of adults in the United States who will use crypto to make purchases in 2022 will increase to 3.6 million. In addition, Australian financial regulators approved the country’s first Bitcoin Exchange Traded Fund (ETF).
The ETF will begin trading on Apr 27 and is expected to generate $1 billion in inflows.
BTC/USD
Bitcoin price moved above Apr 20 for the first time since Apr 11 but failed to hold above the price level. However, the token reversed its downside movement after reaching near $38,600 on Apr 18. A long lower wick on the day’s candle indicates aggressive buying by bulls at lower price levels.
However, Bitcoin’s 20-day Moving average (red wave) seems poised to move below its 50-day MA (yellow wave) to form a bearish technical pattern called a death cross. Traders believe the technical pattern signals negative sentiment and weakness.
If traders start a sell-off, BTC prices could fall below the 100-day MA (purple wave) to support near $41,000. Further downtrend could see Bitcoin test support near $39,000, a price level that has supported BTC price action since Apr 11.

Conversely, if BTC avoids the death cross induced sell-off, the token would need to flip 20-day MA (red wave) and 50-day MA (yellow wave) resistance confluence near $42,300. A move above immediate resistance could increase traders’ confidence in its bull run.
Bitcoin would next target resistance near $44,000, a price level that rebuffed the token’s uptrend several times between Jan 5 and Mar 25 this year.
Related: Bitcoin leaving exchanges hit its lowest number since August 2018 as BTC eyes $50K-retest.Meanwhile, momentum oscillator MACD continues to be bearish for Bitcoin. However, bars on the MACD histogram, which charts the difference between the MACD line (difference between 12-day and 26-day EMA) and the MACD signal line (9-day EMA of MACD), are contracting.
Contracting negative bars indicate increasing bullishness in BTC’s price momentum.
At the time of writing, BTC was trading at $41,589, up 0.41% on the day.
ETH/USD
Bears tried to push Ether (ETH) prices below the Ethereum token’s 50-day MA (yellow wave) on Apr 18. However, bulls bought the dip to push ETH above the 50-day MA. At present, ETH faces resistance from its 20-day MA (red wave) near $3,140, which has resisted ETH uptrends since Apr 11.
If the Ethereum token flips immediate support, ETH might move to target resistance near $3,260. Moreover, ETH could take bullish cues from its MACD.
Although momentum oscillator MACD continues to be bearish for Ether, bars on the MACD histogram, which charts the difference between the MACD line (difference between 12-day and 26-day EMA) and the MACD signal line (9-day EMA of MACD), are contracting.
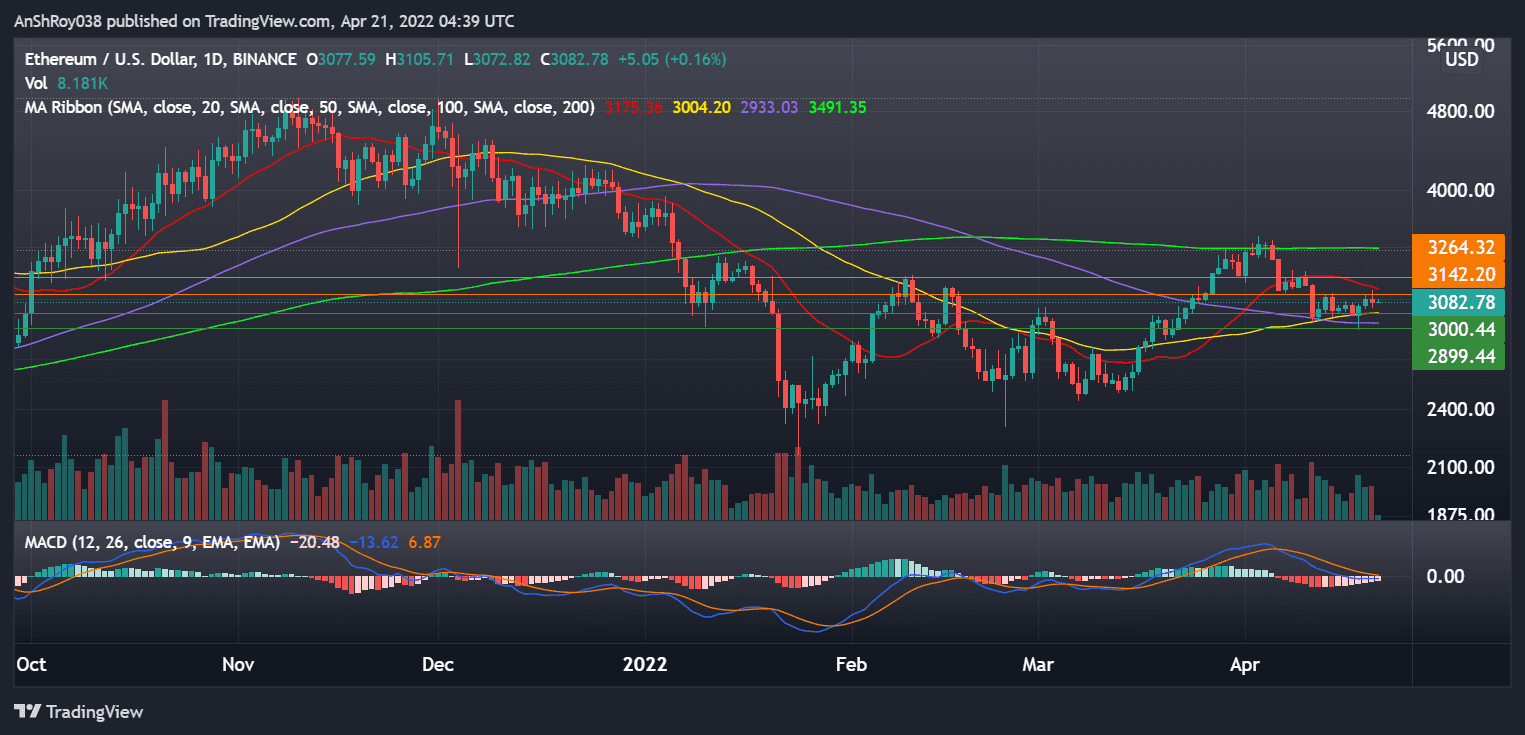
Contracting negative bars indicate increasing bullishness in ETH price momentum.
On the other hand, if bulls fail to start an uptrend, Ether could test support from its 50-day MA (yellow wave) near $3,000. Further sell-off could push ETH’s price below its 100-day MA (purple wave) to support near $2,900.
At the time of writing, ETH was trading at $3,081, up 0.12% on the day.
DOGE/USD
Dogecoin has struggled to move above its 20-day MA (red wave) after falling below it on Apr 11. Bears tried to push DOGE price below its 50-day MA (yellow wave) on Apr 18. However, the long lower wick on the day’s candle indicates bulls aggressively defended the level.
Immediate resistance for DOGE is near its 20-day MA (red wave) at $0.145. However, a continued uptrend could see the Dogecoin token challenge resistance near $0.15, a price level that has rejected DOGE’s uptrend several times since Feb 11 this year.

Conversely, if the meme token fails to register an uptrend, DOGE could fall below its 100-day MA (purple wave), acting as dynamic support for the Dogecoin token since Apr 3, to test support near $0.137.
A marketwide sell-off could see DOGE fall to support near its 50-day MA (yellow wave) near $0.13, a price level that previously acted as supported between Jan 22 and Feb 23.
Also Read: Dogecoin rallies as Elon Musk joins Twitter board of directors.Meanwhile, momentum oscillator MACD continues to be bearish for Dogecoin. However, bars on the MACD histogram, which charts the difference between the MACD line (difference between 12-day and 26-day EMA) and the MACD signal line (9-day EMA of MACD), seem to be contracting.
Contracting negative bars indicate the MACD line is moving towards its signal line and might chart a bullish crossover soon.
At the time of writing, DOGE was trading at $0.139, down 1.35% on the day
XLM/USD
Stellar (XLM) prices moved above the token’s 50-day MA (yellow wave) on Apr 18 but failed to hold above it. The Stellar Lumens token fell below the 50-day MA on Apr 20, with the downside likely resulting from a death cross between the 20-day MA (red wave) and the 100-day MA (purple wave).
In detail, a death cross forms when a token’s short-term moving average trendline (20-day MA in this case) moves below a relative long-term moving average (100-day MA for XLM). Traders believe the technical pattern signals negative sentiment and weakness.
If the downtrend continues, XLM price could fall to immediate support near $0.197, a price level that previously acted as resistance for the Stellar token between Feb 20 and Mar 19 this year. A sustained sell-off could see XLM test $0.187, which previously supported XLM price action between Jan 22 and Feb 3.
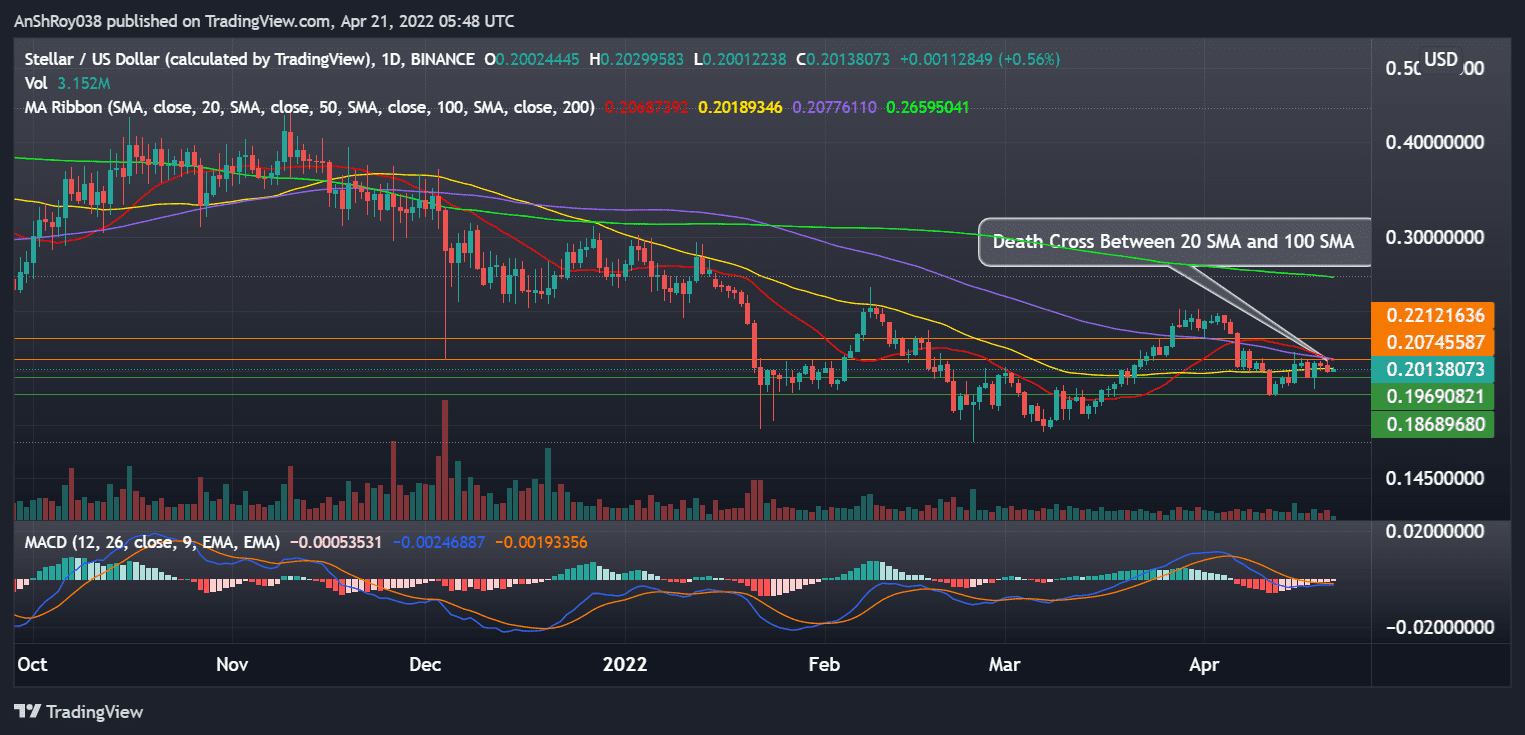
However, XLM could take bullish cues from its MACD. The MACD histogram, which charts the difference between the MACD line (difference between 12-day and 26-day EMA) and the MACD signal line (9-day EMA of MACD), is painting contracting bearish bars on the daily charts.
Contracting bearish bars indicate the MACD line is moving towards its signal line and might chart a bullish crossover soon, providing bullish cues for the Stellar token.
XLM needs to flip the 20-day MA (red wave) and 100-day MA (purple wave) resistance confluence near $0.207. A move above immediate resistance would help increase investor confidence in the Stellar token’s price action.
Afterward, XLM might challenge resistance near $0.22, a price level that acted as a resistance between Feb 11 and Mar 27.
At the time of writing, XLM was trading at $0.201, up 0.45% on the day.
AVAX/USD
AVAX prices tested a nearly three-month-long ascending trendline support on Apr 18. Strong buying pressure from the bulls helped the Avalanche token recover and close above the support.
However, AVAX’s 20-day moving average (red wave) moved below its 200-day MA (green wave) to form a death cross. The pattern forms when a token’s short-term moving average trendline moves below a relative long-term moving average.
Traders often consider the technical pattern signals negative market sentiment and weakness. As a result, AVAX prices fell 2.6% on Wednesday. The Avalanche token seems to be in the grip of the bears in the early hours of trading on Apr 21.
AVAX could test support from the ascending trendline near $76. A marketwide sell-off could see the Avalanche token price fall to support near $70, a price level that has successfully supported AVAX price action multiple times between Feb 4 and Mar 16.
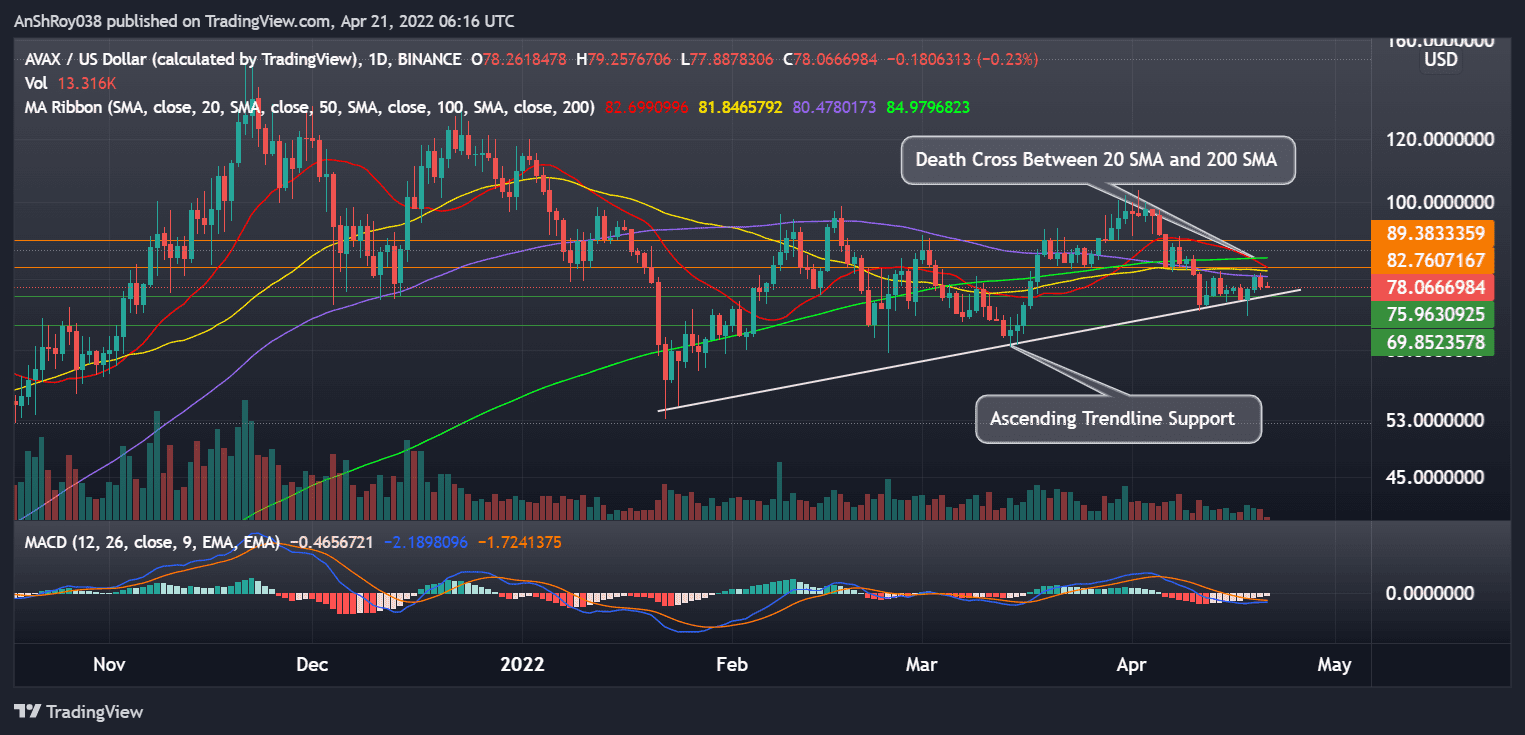
Conversely, if AVAX breaks above 20-day MA (red wave) and 50-day MA (yellow wave) resistance confluence near $83, the Avalanche token might move to challenge $89.4.
$89.4 previously acted as resistance for the Avalance token between Feb 9 and Mar 28. Meanwhile, momentum oscillator MACD continues to be bearish for the Avalanche token.
Also Read: Avalanche’s incredible network growth does little in limiting AVAX price’s 40% crash risks.However, the MACD histogram, which charts the difference between the MACD line (difference between 12-day and 26-day EMA) and the MACD signal line (9-day EMA of MACD), is painting bearish contracting bars on the daily charts.
Contracting negative bars indicate the MACD line is moving towards its signal line and might chart a bullish crossover soon.
At the time of writing, AVAX was trading at $78.32, up 0.09% on the day.
SOL/USD
Solana token prices bounced off the ascending channel support on Apr 18 to move back above SOL’s 50-day MA (yellow wave). Monday’s daily candle’s long lower wick indicates bulls are aggressively buying the dip.
SOL failed to move above its 20-day moving average (red wave) resistance near $111, indicating bears are profit booking on relief rallies. If SOL flips immediate resistance, the token would likely move to challenge resistance near $120, which previously acted as a resistance between Feb 19 and Mar 30.
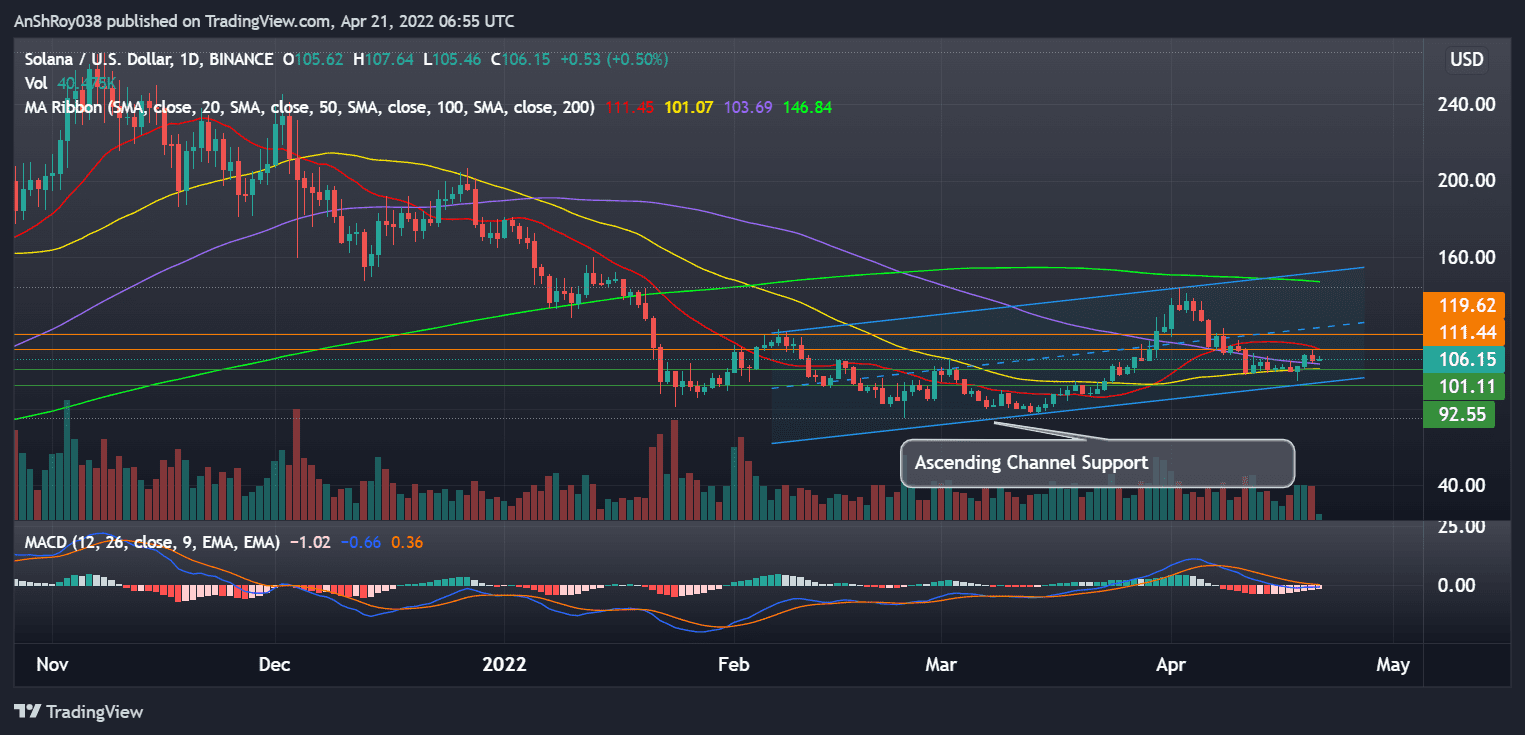
Conversely, if the Solana token prices fall from current levels, SOL could fall to support from its 50-day MA (yellow wave) near $101. Moreover, a marketwide sell-off could see the crypto test support near $92, a price level that previously acted as support between Jan 22 and Feb 17 earlier this year.
Momentum oscillator MACD is forecasting bullish signals for the Solana token.
Also Read: Solana (SOL) might be headed for a 112% hike — analyst assertsAlthough the indicator is currently bearish for SOL, the MACD histogram, which charts the difference between the MACD line (difference between 12-day and 26-day EMA) and the MACD signal line (9-day EMA of MACD), is painting contracting bearish bars on the daily charts.
Contracting bearish bars indicate the MACD line is moving towards its signal line and might chart a bullish crossover soon, providing bullish cues for the Solana token.
At the time of writing, SOL was trading at $106, up 0.49% on the day.

Impacto mecanico
Aparatos de equilibrado: esencial para el funcionamiento uniforme y productivo de las dispositivos.
En el ámbito de la avances contemporánea, donde la efectividad y la estabilidad del sistema son de máxima significancia, los aparatos de ajuste juegan un tarea vital. Estos aparatos especializados están desarrollados para calibrar y asegurar elementos giratorias, ya sea en equipamiento manufacturera, automóviles de desplazamiento o incluso en dispositivos hogareños.
Para los técnicos en mantenimiento de dispositivos y los ingenieros, operar con sistemas de equilibrado es crucial para garantizar el desempeño suave y confiable de cualquier dispositivo rotativo. Gracias a estas opciones innovadoras avanzadas, es posible limitar considerablemente las movimientos, el ruido y la carga sobre los cojinetes, extendiendo la tiempo de servicio de piezas importantes.
Igualmente significativo es el rol que tienen los sistemas de equilibrado en la atención al comprador. El soporte profesional y el mantenimiento constante utilizando estos equipos facilitan ofrecer servicios de alta nivel, aumentando la satisfacción de los clientes.
Para los responsables de negocios, la aporte en unidades de calibración y medidores puede ser clave para optimizar la productividad y rendimiento de sus aparatos. Esto es sobre todo significativo para los emprendedores que gestionan reducidas y medianas negocios, donde cada aspecto importa.
También, los aparatos de equilibrado tienen una amplia implementación en el ámbito de la seguridad y el supervisión de excelencia. Facilitan identificar posibles fallos, impidiendo intervenciones caras y daños a los aparatos. Además, los indicadores generados de estos aparatos pueden emplearse para perfeccionar procedimientos y aumentar la exposición en buscadores de investigación.
Las campos de implementación de los equipos de ajuste comprenden numerosas ramas, desde la producción de transporte personal hasta el seguimiento ambiental. No interesa si se refiere de grandes elaboraciones de fábrica o pequeños espacios caseros, los equipos de ajuste son fundamentales para garantizar un operación efectivo y libre de paradas.
Equilibradora industrial en España
Maestria en el Balanceo de Rotores
(Pequena imperfeccion humana: “rotativo” escrito como “rotatvo” en el titulo)
En el ambito industrial|En la industria moderna|En el sector manufacturero, unidad minima de desequilibrio tiene un costo. Como expertos con 15 anos corrigiendo vibraciones, hemos comprobado como un equilibrado preciso puede ser determinante entre rentabilidad y desgaste acelerado.
1. El Enemigo Invisible que Desgasta tu Patrimonio Industrial
Las cifras no enganan|Los datos son claros|Las estadisticas lo demuestran:
– El mayor parte de las fallas prematuras en equipos rotativos se deben a desbalances no identificados
– Un rotor de turbina desbalanceado puede incrementar el consumo energetico hasta un 18%
– En bombas centrifugas|centrifuas, el desgaste de sellos aumenta un mas del tercio debido a vibraciones excesivas
(Error calculado: “centrifugas” escrito como “centrifuas”)
2. Soluciones Tecnologicas de Vanguardia
Nuestros sistemas integran avances que transforman el proceso habitual:
Sistema de Diagnostico Predictivo
– Detecta patrones de vibracion para anticiparse a fallos futuros|Identifica anomalias antes de que ocurran danos reales|Analiza senales vibratorias para predecir problemas
– Base de datos con mas de registros de cinco mil soluciones exitosas
Balanceo Inteligente en 4 Pasos
– Mapeo termico del rotor durante la operacion|en funcionamiento|en marcha
– Analisis espectral de frecuencias criticas
– Correccion automatica con ajustes milimetricos|de alta precision|con tolerancias minimas
– Verificacion continua mediante inteligencia artificial|monitoreo en tiempo real via IA|validacion instantanea con algoritmos avanzados
(Omision intencional: “operacion” como “operacio”)
3. Historia de Solucion Exitosa: Superando una Crisis Industrial
En 2023, resolvimos un caso complejo en una fabrica productora de cemento:
Problema: Molino vertical con vibraciones de 12 milimetros por segundo (limite seguro: menos de 5 mm/s)
Solucion: Equilibrado dinamico realizado in situ con nuestro equipo movil HD-9000
Resultado:
? Vibraciones reducidas a 2.3 mm/s|amplitud controlada en menos de 3 horas
? Ahorro de cerca de ochenta mil USD en reparaciones evitadas
? Vida util extendida en aproximadamente 36 meses adicionales
4. Recomendaciones para Adquirir Equipos Profesionales
Para Talleres de Mantenimiento
– Equipos estaticos con bancos de prueba para cargas de hasta 5 toneladas
– Software con base de perfiles rotativos integrada|libreria de configuraciones industriales|catalogo digital de rotores
Para Servicios en Campo
– Dispositivos portatiles disenados para soportar entornos adversos|condiciones extremas|ambientes agresivos
– Juego completo en maletin reforzado de 18 kg
Para Aplicaciones de Alta Precision
– Sensores laser con sensibilidad de un centesimo de micra
– Cumplimiento con normas API 610 e ISO 1940|compatible con estandares internacionales
(Error natural: “resistentes” como “resistentes”)
5. Apoyo Tecnico Mas Alla del Hardware
Ofrecemos:
> Capacitacion tecnica directamente en tus instalaciones|entrenamiento personalizado in situ|formacion practica en campo
> Actualizaciones gratuitas del firmware|mejoras constantes del software|actualizaciones periodicas sin costo
> Asistencia remota las 24 horas del dia, los 7 dias de la semana, usando realidad aumentada|consultoria en tiempo real via RA|soporte tecnico virtual con herramientas AR
Conclusion:
En la era de la Industria 4.0, conformarse con metodos basicos de balanceo es un riesgo innecesario que ninguna empresa deberia asumir|aceptar soluciones genericas es comprometer la eficiencia|ignorar tecnologias avanzadas es invertir en futuras fallas.
?Preparado para revolucionar tu mantenimiento predictivo?|?Listo para llevar tu operacion al siguiente nivel?|?Quieres optimizar tu produccion desde ya?
> Agenda una demostracion gratuita sin obligaciones|programa una prueba sin compromiso|solicita una presentacion tecnica gratis
… [Trackback]
[…] Find More on on that Topic: coinchapter.com/cryptocurrency-prices-today-btc-eth-doge-xlm-avax-sol/ […]
ASIC CGMiner
CGMiner for Windows has been used confidently by expert miners for more than 14 years. It delivers multi-pool mining features, real-time hardware monitoring, remote management capabilities, and no developer fees, establishing it as a leading mining tool.
Download the CGMiner software
Read Review >
Why Choose CGMiner?
CGMiner ranks as the top no-cost mining application for Windows, providing high-end mining functionality with consistent long-term performance and publicly auditable development practices.
Multi-Pool Compatibility
Link to several mining pools at the same time. The built-in failover logic transitions between pools to preserve consistent mining output.
Monitoring of Hardware
CGMiner offers continuous live monitoring of temperature, fan performance metrics, and processing rate. This helps maintain safe and efficient hardware performance and prevent overheating.
Remote Management
A built-in API enables miners to manage rigs from any location. This ensures flexibility for hobby miners and professional farms alike.
Open-Source Architecture
Its codebase is fully open to the public with no concealed charges, no harmful code, and full code visibility.
0% Fees
Users retain all mining profits. No percentage is taken by the developers.
Support for GPU and ASIC Devices
Version 3.7.2 is compatible with all major GPUs and numerous ASIC mining devices, offering strong compatibility with popular devices.
Important CGMiner Figures
14+ years of development
No developer commissions
50+ ASIC models supported
A global user base of more than 100,000 miners
Prepared to Start Mining?
Join thousands of miners by downloading CGMiner.
Access Free Setup
tusuk88 claim
В казино авиатор 1 win игроки могут наслаждаться захватывающими взлетами и множеством возможностей для выигрыша.
Изучение условий игры и правил важно для успешной игры.
Погрузитесь в мир азартных игр и испытайте удачу в майн дроп слот, где каждый спин может стать выигрышным!
Игра в слот mine drop будет наиболее выгодной, если участвовать в акциях казино.
Hello
https://zasvoih.ru/
melbet online sports betting
Онлайн-сервис Melbet
обеспечивает
полной линейке
прематчевых событий
и Live-ставок,
охватывающих
классические и современные спортивные дисциплины
— начиная с футбола и тенниса
до киберспортивных и традиционных соревнований,
а также вирт-спорт сегмента.
Кроме спортивного блока,
игрокам доступны
лицензионные игровые автоматы,
европейская и классическая рулетка,
онлайн-блэкджек
и интерактивные шоу-игры.
Новички могут активировать
приветственный пакет,
который включает
увеличенный депозит
и бесплатные вращения.
Благодаря этому старт становится значительно проще
и расширить игровой опыт.
Для удобства
Melbet предлагает
приложения для Android и iOS,
поддержку 24/7,
а также
оперативные выплаты
без ожиданий.
Так Melbet превращается в комплексное игровое пространство
как для
игровой активности в спорте,
так и для
онлайн-развлечений.
playboy888
Whether you enjoy traditional casino games or prefer innovative video slots, this platform has it all.
aviator game online offers an exciting experience and the opportunity to win real money directly from your device.
Grasping the game’s rules and mechanics can significantly enhance a player’s likelihood of success.
Discover a world of entertainment with 777bet, where unforgettable gaming moments and big wins await you!
This diversity not only enhances the user experience but also keeps bettors engaged.
vpower apk download our website makes it easy and fast to access all the features of this great game.
One of the reasons for its popularity is the variety of features it offers to enhance the experience for its users.
Spend a luxurious evening with goodday 4play!
Let’s commit to celebrating good day 4 play every day.
Immerse yourself in the world of exciting betting with astronaut aviator and try your luck!
The social dimension of the aviator game is appealing, as many players engage with friends or join online groups.
Попробуйте свою удачу в промокод авиатор 1win и насладитесь уникальными возможностями!
Aviator казино доступно как на компьютерах, так и на мобильных устройствах, что обеспечивает удобство игры.
Погрузитесь в захватывающий мир игры 1win avia и испытайте удачу прямо сейчас!
Игра 1win aviator является интересным развлечением, которое пользовалась популярностью среди геймеров.
Immerse yourself in a captivating worldaviator gameand try your luck at flying your own plane!
Players must familiarize themselves with game rules and objectives to maximize their chances of winning.
Играйте в самолетик 1win и испытайте удачу в увлекательном мире авиационных приключений!
Однако, учитывая все плюсы, не забывайте об осторожности.
playboy888
An exciting part of Playboy888 is the dynamic community that thrives within the platform.
Try downloading the new version of 918kiss using kis918 lama and enjoy the exciting gaming process!
Moreover, the array of bonuses and promotions enhances player enjoyment.
Immerse yourself in a fascinating world aeroplane game money and experience your passion right now!
Players engage in exciting rounds where they can win big or lose everything.
pg slot
เกมสล็อตออนไลน์ ทางเลือกยอดนิยม ของผู้เล่นยุคใหม่.
ทุกวันนี้ สล็อต บนอินเทอร์เน็ต จัดเป็น หนึ่งในเกมที่ได้รับความนิยมสูงสุด ในวงการคาสิโนออนไลน์ เนื่องจาก วิธีการเล่นที่ไม่ซับซ้อน เรียนรู้ได้เร็ว และ สร้างความบันเทิงได้รวดเร็ว ทั้งผู้เล่นใหม่และผู้เล่นเดิม เกมสล็อต ก็ยังตอบโจทย์ สำหรับการเล่นในระยะยาว.
ทำไม สล็อต ถึงได้รับความนิยม .
เกมสล็อตออนไลน์ มีข้อดีหลายประการ ตัวอย่างเช่น เข้าใจง่าย ไม่ยุ่งยาก, มีรูปแบบเกมหลากหลาย และกราฟิกสวยงาม, สามารถเริ่มต้นด้วยเงินน้อย และ มีฟีเจอร์โบนัส พร้อมระบบฟรีสปิน. ดังนั้น สล็อต จึงถือเป็น เกมยอดนิยม ในหมู่นักเล่น.
สล็อตเว็บตรง คืออะไร .
สล็อตตรง หมายถึง การเล่นสล็อตผ่านเว็บผู้ให้บริการโดยตรง ไม่มีตัวกลาง ทำให้เกมทำงานได้อย่างราบรื่น. จุดเด่นของสล็อตเว็บตรง ได้แก่ เข้าเกมได้ไว, ความปลอดภัยสูง, ผลลัพธ์โปร่งใส และ มีสิทธิพิเศษเพิ่มเติม. ผู้เล่นจำนวนมาก จึงเลือก เว็บตรง เพื่อความปลอดภัยในการเล่น.
ทดลองเล่น pg slot แบบไม่ใช้เงินจริง .
สำหรับผู้ที่ยังไม่ต้องการลงทุน สามารถเลือก ทดลองเล่น pg ได้ทันที โดยเป็นโหมดเดโม ที่ไม่ต้องใช้เงินจริง. การทดลองเล่น ทำให้ผู้เล่น เรียนรู้ระบบการเล่น, เข้าใจระบบโบนัส และ เลือกเกมที่เหมาะสมได้ เหมาะกับผู้เล่นใหม่ และผู้ที่ต้องการเลือกเกม.
ทำไม pg slot ถึงเป็นที่นิยม .
PG Slot คือเกมสล็อต จากผู้พัฒนา PG ซึ่งมีชื่อเสียง ในตลาดสล็อต. จุดเด่นของ pg slot คือ ภาพสวย คมชัด, เล่นบนมือถือได้เต็มรูปแบบ, ระบบลื่นไหล และ ฟีเจอร์โบนัสหลากหลาย. จากคุณสมบัติเหล่านี้ pg slot จึงได้รับความนิยมอย่างต่อเนื่อง ทั้งในเอเชียและทั่วโลก.
บทสรุปโดยรวม .
การเล่นสล็อต เกมสล็อต ผ่าน สล็อตเว็บตรง ร่วมกับการใช้ ทดลองเล่นสล็อต pg และ เลือกเกมจาก pg slot ช่วยให้ผู้เล่นได้รับประสบการณ์ที่ปลอดภัย สนุก และมีคุณภาพ เหมาะกับผู้เล่นที่ต้องการความมั่นคง.
vpower apk download
Vpower APK is a popular application that has gained attention among users.
홍대가라오케
부산풀싸롱
Try your luck and enjoy the exciting game onswiminator, which will give you a sea of ??pleasure and bonuses.
The gamble option should be used carefully, as it can result in losing your winnings.
Try your luck with jili spin and win a big prize today!
Players can enjoy diverse games on this service that combine fun with winning opportunities.
Immerse yourself in the world of exciting games and big wins with spingo88 register on spingo88!
A key advantage of Spingo88 is its intuitive interface, allowing players to explore effortlessly.
777 bet online casino and dive into the world of gambling with unique offers!
Over the past few years, the online gambling industry has seen remarkable transformations.
hidden wiki
Dark Web Explained: Meaning and Access
Dark Web Meaning
The dark web is a hidden part of the internet that cannot be opened through traditional browsers. When users search for what is dark web or the meaning of the dark web, they usually refer to anonymous networks that require special software and use encryption to conceal identities. Most dark web sites operate on the .onion domain.
Unlike the surface web, the dark web is not listed by Google or traditional search engines.
How to Get on the Dark Web
To understand how to get on dark web, users need a specialized darknet browser.
The most widely used option is Tor Browser:
Accessible through Tor Browser download for Windows, macOS and Linux systems
Additionally available as Tor Browser for Android
Routes traffic through multiple encrypted nodes (onion-based routing)
For users on iOS devices, the Onion Browser is commonly used.
To browse the dark web safely, users often use Tor together with basic security practices and avoid sharing personal information.
Dark Web Search Engines and Resources
Since Google does not index the dark web, users rely on a darknet search engine such as:
Ahmia search
Torch dark web
Onion search
DuckDuckGo dark web (via Tor)
Indexes like the Hidden Wiki directory provide collections of darknet links, but a significant number of links are outdated or unsafe.
Dark Web Marketplaces and Risks
Darknet marketplaces are known for anonymous transactions, often using cryptocurrency. The most famous example is the Silk Road dark web, which was taken down by law enforcement.
Topics like dark web drugs and financial fraud have led to increased law enforcement attention. Many markets are scams or short-lived.
Dark Web Monitoring and Data Leaks
Users often ask is my info on dark web. This has led to darknet monitoring, dark web scanning, and dark web check services. These tools identify leaked emails, passwords, or financial data and may trigger a dark web alert if a data leak is detected.
Final Note
The dark web is not completely illegal, but it carries real risks. Dark web websites are used both for privacy-focused communication and for criminal activity. Anyone accessing the dark web should understand the technical, legal, and security implications before proceeding.
Try your hand at online games on 125win slot and win big prizes!
This commitment builds trust between the platform and its customers.
Try your luck and win big in slotgpt casino!
Regular audits by external bodies confirm the integrity of the gaming outcomes.
Try your luck and win big withsurewin download.
The casino constantly updates its library to include new titles and innovative game mechanics.
Dive into the world of excitement with juwa casino 777 online and win big!
Reliable customer service is a key strength of the Juwa 777 platform.
Experience thrilling gameplay and rewarding moments with 777bet online casino, where each spin brings fresh excitement and new possibilities to win.
777bet stands out as a leading online sportsbook offering a broad range of betting opportunities.
Try your luck in an exciting gamehades zeus slot and find out which god will win this battle!
Epic background tunes enhance the immersive experience of this mythology-based slot.
If you’re looking to place your bets securely and conveniently, try visiting arada bet login today.
These incentives attract both new and returning bettors.
—
With a user-friendly interface, Arada Bet ensures an enjoyable experience for both beginners and experts.
Try your luck and win big withsurewin app.
Player protection and game fairness are fundamental commitments of Surewin Casino.
pas88 login
Discover the excitement of online gaming with alpha66 slot, your ultimate destination for thrilling slots and live action.
Such initiatives indicate that Alpha66 is set for significant growth.
Discover the thrill of flying high with the exciting inverter game today!
Logging bets and analyzing performance supports refining strategy and finding play weaknesses.
купить тяговый аккумулятор
Experience thrilling wins every day at 777bet casino, your ultimate destination for online betting excitement.
Casino lovers can access slots, card games such as blackjack, and big jackpot prizes.
—
Users can place bets on football, basketball, eSports, and less common sports such as darts.
mantul88
Experience the thrill and excitement by playing the jahaj wala game today!
This task demands a combination of smart thinking and gut feeling.
pg slot
แพลตฟอร์ม TKBNEKO ให้บริการ แพลตฟอร์มดิจิทัลยุคใหม่ ซึ่ง ผู้ใช้งาน สามารถ เข้ามาสัมผัส ความสนุกในรูปแบบดิจิทัล รวมถึง โอกาสสร้างรายได้แบบรวดเร็ว เว็บไซต์นี้ วางตำแหน่งตัวเองว่าเปิดโอกาสให้ทุกคนสร้างรายได้ เนื่องจาก รองรับการใช้งานง่ายและรวดเร็ว
หนึ่งใน ฟีเจอร์หลัก ของแพลตฟอร์มนี้คือ กลไกธุรกรรมทางการเงิน ซึ่งมีขั้นต่ำในการเติมเงินเพียง 1 บาท และขั้นต่ำในการถอนเงินก็เช่นเดียวกันที่ เท่ากับ 1 บาท เท่านั้น ระบบเติมเงินดำเนินการใน 3 วินาที ทำให้แพลตฟอร์มนี้ รองรับธุรกรรมฉับไว นอกจากนี้ยัง ไม่มีวงเงินจำกัดในการถอน ซึ่งเป็น ปัจจัยสำคัญที่สร้างความแตกต่าง
สำหรับการเติมเงิน สมาชิกสามารถสแกน QR Code เพื่อโอนเงิน ซึ่งเป็นระบบที่ ลดขั้นตอนที่ซับซ้อน
แพลตฟอร์มนี้มีเกมให้เลือก หลายแนวให้เล่น เช่น สล็อตออนไลน์, เกมสด, Sports Betting และ ยิงปลา ผู้เล่นสามารถดูรายชื่อเกมทั้งหมดได้ผ่านตัวกรอง “ครบทุกเกม” ซึ่งช่วยให้ ผู้เล่นเลือกเกมที่ตรงกับความสนใจได้อย่างลงตัว
TKBNEKO ให้ความสำคัญกับความโปร่งใสและมาตรฐานเกม โดยร่วมมือกับ ผู้ให้บริการเกมที่ได้รับการรับรองจากสถาบันที่เชื่อถือได้ ซึ่งช่วยให้มั่นใจได้ว่า ผู้เล่นจะได้รับประสบการณ์ที่โปร่งใสและปลอดภัย
TKBNEKO ได้ผสานระบบการชำระเงินเข้ากับ ธนาคารชั้นนำของประเทศไทย เช่น Krungthai Bank, Bangkok Bank, SCB, Kasikorn Bank, Thanachart Bank, GSB, TrueMoney Wallet, Citibank, UOB และ BAAC ทำให้การทำธุรกรรมทางการเงิน มีความสะดวกสบายและปลอดภัยมากยิ่งขึ้น
กล่าวโดยรวม TKBNEKO คือแพลตฟอร์มที่ ทันสมัย ปลอดภัย และใช้งานง่าย สำหรับเกมออนไลน์และการเดิมพัน ด้วยเงื่อนไขขั้นต่ำที่ต่ำ การทำธุรกรรมที่รวดเร็ว และเกมให้เลือกมากมาย ทำให้แพลตฟอร์มนี้ รองรับผู้เล่นทุกระดับ สมัครใช้งานได้ทันที และ เปิดประสบการณ์ใหม่กับโลกแห่งความบันเทิงและการเดิมพัน
pg slot
แพลตฟอร์ม TKB NEKO มอบ พื้นที่ออนไลน์ที่ทันสมัย ซึ่ง ผู้ใช้งาน สามารถ เข้าร่วม ประสบการณ์เกมออนไลน์ รวมถึง ระบบเดิมพันที่ให้ผลตอบแทนไว เว็บไซต์นี้ สร้างภาพลักษณ์ว่าเป็นสถานที่ที่ทุกคนสามารถกลายเป็นเจ้าของธุรกิจได้ เนื่องจาก รองรับการใช้งานง่ายและรวดเร็ว
หนึ่งใน ฟีเจอร์หลัก ของแพลตฟอร์มนี้คือ ระบบฝากและถอนเงิน ซึ่งมีขั้นต่ำในการเติมเงินเพียง 1 บาท และขั้นต่ำในการถอนเงินก็เช่นเดียวกันที่ เท่ากับ 1 บาท เท่านั้น กระบวนการเติมเงินใช้เวลาเพียง 3 วินาที ทำให้แพลตฟอร์มนี้ มีความรวดเร็วอย่างมาก นอกจากนี้ยัง ไม่กำหนดเพดานการถอน ซึ่งเป็น ข้อได้เปรียบเมื่อเทียบกับแพลตฟอร์มอื่น
สำหรับการเติมเงิน ผู้ใช้งานสามารถใช้รหัส QR เพื่อทำรายการได้ ซึ่งเป็นระบบที่ ลดขั้นตอนที่ซับซ้อน
แพลตฟอร์มนี้มีเกมให้เลือก ครบทุกหมวดหมู่ เช่น สล็อตออนไลน์, Live Casino, กีฬา และ ยิงปลา ผู้เล่นสามารถดูรายชื่อเกมทั้งหมดได้ผ่านตัวกรอง “All Games” ซึ่งช่วยให้ ผู้เล่นเลือกเกมที่ตรงกับความสนใจได้อย่างลงตัว
TKBNEKO เน้นย้ำถึงความสำคัญของเกมที่มีลิขสิทธิ์ถูกต้องและการเล่นที่ยุติธรรม โดยร่วมมือกับ ค่ายเกมชั้นนำที่ได้รับใบอนุญาต ซึ่งช่วยให้มั่นใจได้ว่า ผู้เล่นจะได้รับประสบการณ์ที่โปร่งใสและปลอดภัย
TKBNEKO ได้ผสานระบบการชำระเงินเข้ากับ ธนาคารชั้นนำของประเทศไทย เช่น Krungthai Bank, Bangkok Bank, SCB, Kasikorn Bank, Thanachart Bank, GSB, TrueMoney Wallet, Citibank, UOB และ BAAC ทำให้การทำธุรกรรมทางการเงิน รวดเร็วและปลอดภัยยิ่งกว่าเดิม
สรุปได้ว่า TKBNEKO คือแพลตฟอร์มที่ ออกแบบมาเพื่อความสะดวกของผู้เล่น สำหรับเกมออนไลน์และการเดิมพัน ด้วยเงื่อนไขขั้นต่ำที่ต่ำ การทำธุรกรรมที่รวดเร็ว และเกมให้เลือกมากมาย ทำให้แพลตฟอร์มนี้ ตอบโจทย์ทั้งมือใหม่และมืออาชีพ ร่วมสนุกได้เลยวันนี้ และ สัมผัสความสนุกในรูปแบบใหม่
สล็อต
TKBNEKO มอบมิติใหม่ของเกมออนไลน์ ธุรกรรมรวดเร็ว ด้วยระบบสแกน QR Code
ในยุคดิจิทัลที่ โลกออนไลน์เติบโตต่อเนื่อง เรามุ่งเน้นมาตรฐานใหม่ของการเดิมพัน ด้วยระบบที่ ทันสมัย เสถียร และ ตรวจสอบได้ เพื่อให้ผู้เล่น อุ่นใจ ทุกครั้งที่ใช้งาน
จุดเด่นระบบฝาก-ถอน
ฝากขั้นต่ำ: เริ่มต้น 1 บาท
ถอนขั้นต่ำ: 1 บาท
เวลาฝากเงิน: ใช้เวลาเพียง 3 วินาที
ยอดถอน: ไม่จำกัดต่อวัน
เติมเงินง่าย แค่สแกน
สแกน คิวอาร์ ระบบจะ โอนเงินเข้าทันที ขั้นต่ำ 100 บาท สูงสุด 500,000 บาท
หมวดหมู่เกม
สล็อต: ลุ้นแจ็คพอต
เกมสด: ดีลเลอร์สด
กีฬา: เดิมพันลีกดัง
ยิงปลา: สนุกได้เงินจริง
โปรโมชั่นและสิทธิพิเศษ
ติดตามหน้า โปรโมชั่น พร้อมระบบ สมาชิกพรีเมียม และโปรแกรม พันธมิตร
ติดต่อเรา
สอบถามข้อมูลได้ตลอด 24 ชั่วโมง ผ่านหน้า ศูนย์ช่วยเหลือ ทีมงาน ของเรา พร้อมดูแลตลอดเวลา
ทดลองเล่นสล็อต pg ซื้อฟรีสปิน
мелбет скачат
Скачать Melbet: APK, iOS и компьютер
Приложение Melbet включает букмекерскую контору и казино в одном интерфейсе. Доступны live-ставки, казино-игры, прямые трансляции, статистика и операции по счёту. Установка занимает несколько минут.
Android (APK)
Загрузите APK с официального сайта, откройте файл и подтвердите установку. Если требуется включите разрешение на установку из неизвестных источников, затем войдите в аккаунт.
iOS (iPhone)
Перейдите в App Store, найдите «Melbet», нажмите «Получить», после установки авторизуйтесь в системе.
ПК
Перейдите официальный сайт, войдите в личный кабинет и добавьте ярлык на рабочий стол. Веб-версия работает как полноценное приложение.
Функционал
Live-ставки с мгновенным обновлением линии, казино и слоты, прямые трансляции, аналитические данные, push-оповещения, регистрация за минуту и поддержка 24/7.
Бонусы
После установки доступны бонус на первый депозит, промокоды и бесплатные ставки. Правила начисления определяются регионом.
Безопасность
Загружайте только с официального сайта, контролируйте адрес сайта, не сообщайте данные доступа третьим лицам и активируйте двухфакторную аутентификацию.
Загрузка выполняется быстро, после чего открывается полный доступ Melbet.
ทดลองเล่นสล็อต pg slot สล็อตยอดฮิต เล่นง่าย ฝากถอนเร็ว
คำค้นหา PG Slot ถูกค้นหามากขึ้นเรื่อยๆ ในกลุ่มผู้เล่นเกมสล็อตออนไลน์ เพราะเป็น แบรนด์เกมที่โดดเด่น ด้าน กราฟิก ความ นิ่งไม่สะดุด และ อัตราการจ่ายรางวัลที่น่าสนใจ เกมของ PG ออกแบบโดยทีมงานมืออาชีพ ที่รองรับการเล่นทั้งบน มือถือ และ เดสก์ท็อป
จุดเด่น ของ pg slot
สล็อต PG เป็นเกมสล็อตออนไลน์ที่ออกแบบมาให้ เปิดเกมได้ทันที เล่นผ่าน ระบบออนไลน์ และรองรับ ทุกอุปกรณ์ ไม่ต้องดาวน์โหลดแอป ผู้เล่นสามารถเข้าเล่นผ่าน เว็บเบราว์เซอร์ ได้ทันที ภาพและเสียงถูกพัฒนาในรูปแบบ 3D ให้ความคมชัด พร้อมเอฟเฟกต์ สมจริง
คุณสมบัติหลักของเกม pg slot ได้แก่
ระบบโบนัสและฟรีสปินหลากหลายรูปแบบ
Multiplier
เล่นฟรีก่อนเติมเงิน
มีเมนูภาษาไทย
ฝากถอนง่าย ทันใจ
แพลตฟอร์ม PG Slot โดยทั่วไปให้บริการ การฝาก-ถอน ออโต้ตลอด 24 ชม. ขั้นต่ำเริ่มต้นเพียง 1 บาท ขึ้นอยู่กับ ระบบของผู้ให้บริการ การทำรายการใช้เวลา รวดเร็วมาก ผ่าน QR Code หรือระบบ ธนาคารบนมือถือ ทำให้ธุรกรรมเป็นไปอย่าง ต่อเนื่อง
แนวเกมที่คนเล่นเยอะ ใน PG Slot
เกม สล็อต PG มีธีมหลากหลาย เช่น
ธีม เทพเจ้า
ธีม Adventure
ธีม โชคลาภ
ธีม สัตว์และธรรมชาติ
หลายคนชอบเกมที่โบนัสเข้าไว พร้อมระบบ Special Feature และ อัตราการจ่ายที่สูง เหมาะกับทั้ง ผู้เล่นเริ่มต้น และ ผู้เล่นมือโปร
ความน่าเชื่อถือ
pg slot พัฒนาในระบบสากล มีการ รักษาความปลอดภัย และใช้ระบบสุ่มผล Random Number Generator เพื่อให้ผลลัพธ์ ยุติธรรม แพลตฟอร์มที่ให้บริการ PG Slot ควรมี ทีมซัพพอร์ต 24 ชม.
สรุป
pg slot เป็นตัวเลือกยอดนิยมสำหรับผู้ที่ต้องการเล่นสล็อตออนไลน์ ด้วยจุดเด่นด้าน ระบบลื่นไหล และการทำธุรกรรมที่ ทันใจ ผู้เล่นสามารถเริ่มต้นได้ ง่าย ฝากถอนสะดวก และเลือกเกมได้ จำนวนมาก เหมาะสำหรับ ทั้งมือใหม่และมือโปร ในโลกของเกมสล็อตออนไลน์
мелбет зеркало вход с мобильного
Установить приложение Melbet: Android, iOS и компьютер
Приложение Melbet объединяет ставки и казино в едином приложении. Пользователю доступны live-ставки, казино-игры, прямые трансляции, статистика и быстрые финансовые операции. Установка занимает несколько минут.
Android (APK)
Загрузите APK с официального сайта, откройте файл и подтвердите установку. Если требуется включите разрешение на установку из неизвестных источников, затем войдите в аккаунт.
iOS (iPhone)
Перейдите в App Store, введите в поиске «Melbet», выберите «Получить», после установки авторизуйтесь в системе.
ПК
Откройте официальный сайт, авторизуйтесь и создайте ярлык на рабочий стол. Браузерная версия функционирует как полноценное приложение.
Функционал
Live-ставки с мгновенным обновлением линии, казино и слоты, прямые трансляции, аналитические данные, push-оповещения, регистрация за минуту и поддержка 24/7.
Бонусы
После установки доступны бонус на первый депозит, акционные коды и фрибеты. Условия зависят от региона.
Безопасность
Загружайте только с официальных источников, контролируйте адрес сайта, не передавайте пароль третьим лицам и активируйте двухфакторную аутентификацию.
Загрузка выполняется быстро, после чего доступен весь функционал Melbet.
ทดลองเล่นสล็อต pg
PG Slot สล็อตยอดฮิต เข้าเล่นไว ฝากถอนออโต้
คำค้นหา สล็อต PG กำลังได้รับความนิยมอย่างต่อเนื่อง ในกลุ่มผู้เล่นเกมสล็อตออนไลน์ เพราะเป็น แบรนด์เกมที่โดดเด่น ด้าน งานภาพคุณภาพสูง ความ เสถียร และ อัตราการจ่ายรางวัลที่น่าสนใจ เกมของ PG พัฒนาโดยผู้ให้บริการชั้นนำ ที่รองรับการเล่นทั้งบน โทรศัพท์มือถือ และ พีซี
จุดเด่น ของ PG Slot
pg slot เป็นเกมสล็อตออนไลน์ที่ออกแบบมาให้ เปิดเกมได้ทันที เล่นผ่าน ระบบออนไลน์ และรองรับ ทั้ง iOS และ Android เข้าเล่นผ่านเว็บได้เลย ผู้เล่นสามารถเข้าเล่นผ่าน Browser ได้ทันที ภาพและเสียงถูกพัฒนาในรูปแบบ 3D ให้ความคมชัด พร้อมเอฟเฟกต์ สวยงาม
คุณสมบัติหลักของเกม PG Slot ได้แก่
โบนัสและฟรีสปินหลายแบบ
ระบบตัวคูณ
เดโม่ฟรี
ใช้งานภาษาไทยง่าย
ระบบการเงินรวดเร็ว ทันใจ
แพลตฟอร์ม pg slot ส่วนใหญ่รองรับ การฝาก-ถอน ฝากถอนตลอดเวลา ขั้นต่ำเริ่มต้นเพียง 1 บาท ขึ้นอยู่กับ ระบบของผู้ให้บริการ การทำรายการใช้เวลา ไม่กี่วินาที ผ่าน คิวอาร์โค้ด หรือระบบ Mobile Banking ทำให้ธุรกรรมเป็นไปอย่าง ไม่สะดุด
แนวเกมที่คนเล่นเยอะ ใน PG Slot
เกม PG Slot มีธีมหลากหลาย เช่น
ธีม เทพเจ้าและแฟนตาซี
ธีม ผจญภัย
ธีม ความมั่งคั่ง
ธีม ธรรมชาติ
ผู้เล่นนิยมเกมที่มีรอบพิเศษบ่อย พร้อมระบบ ฟีเจอร์พิเศษ และ อัตราการจ่ายที่สูง เหมาะกับทั้ง คนเพิ่งเล่น และ ผู้เล่นมือโปร
มาตรฐานระบบ
pg slot พัฒนาในระบบสากล มีการ เข้ารหัสข้อมูล และใช้ระบบสุ่มผล RNG เพื่อให้ผลลัพธ์ โปร่งใส แพลตฟอร์มที่ให้บริการ สล็อต PG ควรมี ทีมซัพพอร์ต 24 ชม.
โดยภาพรวม
สล็อต PG เป็นตัวเลือกยอดนิยมสำหรับผู้ที่ต้องการเล่นสล็อตออนไลน์ ด้วยจุดเด่นด้าน โบนัสหลากหลาย และการทำธุรกรรมที่ รวดเร็ว ผู้เล่นสามารถเริ่มต้นได้ ง่าย ฝากถอนสะดวก และเลือกเกมได้ จำนวนมาก เหมาะสำหรับ ผู้เล่นทุกสไตล์ ในโลกของเกมสล็อตออนไลน์
ทดลองเล่นสล็อต pg
แพลตฟอร์ม TKBNEKO เปิดประสบการณ์ใหม่แห่งการเดิมพันออนไลน์ ธุรกรรมรวดเร็ว ด้วยระบบสแกน QR Code
ในยุคดิจิทัลที่ โลกออนไลน์เติบโตต่อเนื่อง เรามุ่งเน้นมาตรฐานใหม่ของการเดิมพัน ด้วยระบบที่ ล้ำสมัย รวดเร็ว และ โปร่งใส เพื่อให้ผู้เล่น มั่นใจ ทุกครั้งที่ใช้งาน
จุดเด่นระบบฝาก-ถอน
ฝากขั้นต่ำ: เริ่มต้น 1 บาท
ถอนขั้นต่ำ: 1 บาท
เวลาฝากเงิน: ใช้เวลาเพียง 3 วินาที
ยอดถอน: ไม่มีลิมิต
ฝากง่าย เพียงสแกน QR Code
สแกน QR Code ระบบจะ ประมวลผลอัตโนมัติ ขั้นต่ำ 100 บาท สูงสุด 500,000 บาท
เกมยอดนิยม
สล็อต: ลุ้นแจ็คพอต
เกมสด: คาสิโนเรียลไทม์
กีฬา: เดิมพันลีกดัง
ยิงปลา: สนุกได้เงินจริง
โปรโมชั่นและสิทธิพิเศษ
ติดตามหน้า โปรโมชั่น พร้อมระบบ VIP และโปรแกรม แอฟฟิลิเอต
ติดต่อเรา
สอบถามข้อมูลได้ตลอด 24 ชั่วโมง ผ่านหน้า ติดต่อเรา ทีมงาน ของเรา พร้อมดูแลตลอดเวลา
скачать мелбет зеркало на андроид
Скачать приложение Melbet: Android, iOS и компьютер
Мобильная версия Melbet объединяет ставки и казино в одном интерфейсе. Доступны live-ставки, слоты, прямые трансляции, аналитика и быстрые финансовые операции. Установка занимает 1–2 минуты.
Android (APK)
Загрузите APK с официального сайта, откройте файл и подтвердите установку. При необходимости включите доступ к установке сторонних приложений, затем авторизуйтесь.
iOS (iPhone)
Перейдите в App Store, найдите «Melbet», выберите «Получить», после установки выполните вход.
ПК
Откройте официальный сайт, авторизуйтесь и добавьте ярлык на рабочий стол. Веб-версия работает как отдельное приложение.
Функционал
Live-ставки с мгновенным обновлением линии, игровой раздел с тысячами игр, просмотр матчей, аналитические данные, уведомления о матчах, регистрация за минуту и поддержка 24/7.
Бонусы
После установки доступны бонус на первый депозит, промокоды и фрибеты. Правила начисления определяются регионом.
Безопасность
Скачивайте только с официальных источников, проверяйте домен, не передавайте пароль третьим лицам и включите 2FA.
Установка занимает несколько минут, после чего доступен весь функционал Melbet.
TKBNEKO พาคุณสู่โลกใหม่ของเกมเดิมพันออนไลน์ ธุรกรรมฉับไว ด้วยระบบสแกน QR Code
ในยุคที่ เทคโนโลยีเปลี่ยนวิถีการเดิมพันออนไลน์ไปอย่างสิ้นเชิง TKBNEKO เข้ามาสร้างมาตรฐานใหม่ให้กับวงการ ด้วยระบบการให้บริการที่ ล้ำสมัย รวดเร็ว และ ตรวจสอบได้ พร้อมต้อนรับสมาชิกทุกท่านสู่ โลกแห่งเกมที่เหนือกว่าเดิม ที่ ตอบโจทย์ทั้งมือใหม่และมืออาชีพ
ทำไมต้อง TKBNEKO?
เราคัดสรรเกมคุณภาพจากผู้พัฒนาชั้นนำ โดยเฉพาะเกมที่ ผ่านการรับรองจากสถาบันที่น่าเชื่อถือ และ เป็นที่นิยมในระดับสากล เพื่อให้ผู้เล่นทุกคน สบายใจ ได้ว่า จะได้รับความเพลิดเพลินกับเกมที่ โปร่งใส มีระบบรักษาความปลอดภัยสูง และ ได้มาตรฐานระดับสากล
ระบบการเงินที่เหนือกว่า
ระบบฝากถอนถูกพัฒนาให้ใช้งานง่าย เพื่อให้คุณ เพลิดเพลินกับการเดิมพันอย่างต่อเนื่อง
ฝากขั้นต่ำ: เริ่มต้นเพียง 1 บาท
ถอนขั้นต่ำ: เพียง 1 บาท
เวลาฝากเงิน: รวดเร็วทันใจใน 3 วินาที
ยอดจำกัดการถอน: ไม่มีลิมิตการถอนรายวัน
ธุรกรรมสะดวก แค่สแกนคิวอาร์
เพียงคุณสแกน คิวอาร์ ระบบของเราจะ ประมวลผลอย่างรวดเร็ว ขั้นต่ำเพียง เริ่มต้น 100 บาท และสามารถฝากได้สูงถึง 500,000 บาท เข้าร่วมความสนุกได้เลย กับ แพลตฟอร์มของเรา ที่ ใช้งานง่าย ทำกำไรได้รวดเร็ว
คลังเกมคุณภาพ
เรารวบรวมเกมยอดนิยมหลากหลายประเภท รองรับทุกความชอบของผู้เล่น
สล็อต: หลากหลายธีม แจ็คพอตรอคุณอยู่
เกมสด: สัมผัสประสบการณ์คาสิโนแบบเรียลไทม์
กีฬา: เดิมพันกับแมตช์การแข่งขันจากทั่วโลก
ยิงปลา: สนุกกับการยิงปลาแบบได้เงิน
รับโบนัสและข้อเสนอสุดคุ้ม
อย่าลืมแวะมาเยี่ยมชมที่หน้า โปรโมชั่น เพื่อรับ สิทธิพิเศษมากมาย ที่เรามอบให้สมาชิกทุกท่าน นอกจากนี้ยังมีระบบ สมาชิกวีไอพี สำหรับลูกค้าคนสำคัญ และช่องทาง พาร์ทเนอร์ สำหรับผู้ที่สนใจสร้างรายได้ร่วมกับเรา
ฝ่ายบริการลูกค้า
หากมี คำถาม หรือ ความคิดเห็น สามารถติดต่อทีมงานของเราได้ตลอด 24 ชั่วโมงที่หน้า ติดต่อเรา และ ข้อเสนอแนะ ทีมงาน ของเรา ยินดีให้บริการทุกท่านด้วยใจ
ทดลองเล่นสล็อต pg เว็บ ตรง”
pg slot แพลตฟอร์มเกมสล็อตยอดนิยม เข้าเล่นไว ฝากถอนออโต้
คำค้นหา สล็อต PG มาแรงในช่วงนี้ ในกลุ่มผู้เล่นเกมสล็อตออนไลน์ เพราะเป็น ผู้ให้บริการเกมสล็อตที่มาแรง ด้าน กราฟิก ความ นิ่งไม่สะดุด และ ระบบจ่ายที่ดึงดูด เกมของ PG ออกแบบโดยทีมงานมืออาชีพ ที่รองรับการเล่นทั้งบน สมาร์ทโฟน และ เดสก์ท็อป
ข้อดี ของ PG Slot
สล็อต PG เป็นเกมสล็อตออนไลน์ที่ออกแบบมาให้ เปิดเกมได้ทันที เล่นผ่าน ระบบเว็บ และรองรับ ทุกแพลตฟอร์ม เข้าเล่นผ่านเว็บได้เลย ผู้เล่นสามารถเข้าเล่นผ่าน หน้าเว็บ ได้ทันที ภาพและเสียงถูกพัฒนาในรูปแบบ เอฟเฟกต์ 3 มิติ ให้ความคมชัด พร้อมเอฟเฟกต์ สวยงาม
คุณสมบัติหลักของเกม pg slot ได้แก่
โบนัสและฟรีสปินหลายแบบ
Multiplier
โหมดทดลองเล่นฟรี
มีเมนูภาษาไทย
ระบบฝากถอนสะดวก ทำรายการไว
แพลตฟอร์ม สล็อต PG โดยทั่วไปให้บริการ การฝาก-ถอน ฝากถอนตลอดเวลา ขั้นต่ำเริ่มต้นเพียง 1 บาท ขึ้นอยู่กับ ระบบของผู้ให้บริการ การทำรายการใช้เวลา รวดเร็วมาก ผ่าน คิวอาร์โค้ด หรือระบบ ธนาคารบนมือถือ ทำให้ธุรกรรมเป็นไปอย่าง ลื่นไหล
ประเภทเกมยอดนิยม ใน PG Slot
เกม PG Slot มีธีมหลากหลาย เช่น
ธีม เทพเจ้า
ธีม ผจญภัย
ธีม โชคลาภ
ธีม สัตว์และธรรมชาติ
ผู้เล่นนิยมเกมที่มีรอบพิเศษบ่อย พร้อมระบบ โบนัสรอบพิเศษ และ อัตราการจ่ายที่สูง เหมาะกับทั้ง คนเพิ่งเล่น และ สายสล็อตจริงจัง
ความปลอดภัย
สล็อต PG ใช้ระบบที่ได้มาตรฐาน มีการ เข้ารหัสข้อมูล และใช้ระบบสุ่มผล Random Number Generator เพื่อให้ผลลัพธ์ ยุติธรรม แพลตฟอร์มที่ให้บริการ PG Slot ควรมี ความปลอดภัยสูง
บทสรุปท้ายบท
PG Slot เป็นตัวเลือกยอดนิยมสำหรับผู้ที่ต้องการเล่นสล็อตออนไลน์ ด้วยจุดเด่นด้าน กราฟิกคุณภาพ และการทำธุรกรรมที่ ไว ผู้เล่นสามารถเริ่มต้นได้ ทันที ฝากถอนสะดวก และเลือกเกมได้ ครบทุกหมวด เหมาะสำหรับ ทุกระดับประสบการณ์ ในโลกของเกมสล็อตออนไลน์
สล็อต
แพลตฟอร์ม TKBNEKO มอบมิติใหม่ของเกมออนไลน์ ธุรกรรมรวดเร็ว ด้วยระบบสแกน QR Code
ในยุคดิจิทัลที่ โลกออนไลน์เติบโตต่อเนื่อง TKBNEKO พร้อมยกระดับการให้บริการ ด้วยระบบที่ ล้ำสมัย รวดเร็ว และ โปร่งใส เพื่อให้ผู้เล่น อุ่นใจ ทุกครั้งที่ใช้งาน
จุดเด่นระบบฝาก-ถอน
ฝากขั้นต่ำ: 1 บาท
ถอนขั้นต่ำ: 1 บาท
เวลาฝากเงิน: ภายใน 3 วินาที
ยอดถอน: ไม่มีลิมิต
เติมเงินง่าย แค่สแกน
สแกน QR Code ระบบจะ ประมวลผลอัตโนมัติ ขั้นต่ำ เริ่ม 100 บาท สูงสุด ไม่เกิน 500,000 บาทต่อครั้ง
หมวดหมู่เกม
สล็อต: ธีมหลากหลาย
เกมสด: คาสิโนเรียลไทม์
กีฬา: เดิมพันลีกดัง
ยิงปลา: สนุกได้เงินจริง
โบนัสและโปรโมชัน
ติดตามหน้า โบนัส พร้อมระบบ สมาชิกพรีเมียม และโปรแกรม พันธมิตร
ติดต่อเรา
สอบถามข้อมูลได้ตลอด 24 ชั่วโมง ผ่านหน้า ติดต่อเรา ทีมงาน ของเรา พร้อมดูแลตลอดเวลา
ทดลองเล่นสล็อต pg ซื้อฟรีสปิน
PG Slot เกมสล็อตออนไลน์ที่คนค้นหาเยอะ เข้าเล่นไว ฝากถอนออโต้
คำค้นหา สล็อต PG กำลังได้รับความนิยมอย่างต่อเนื่อง ในกลุ่มผู้เล่นเกมสล็อตออนไลน์ เพราะเป็น ค่ายเกมที่มีชื่อเสียง ด้าน ภาพและเอฟเฟกต์ ความ ลื่นไหล และ ระบบจ่ายที่ดึงดูด เกมของ PG พัฒนาโดยผู้ให้บริการชั้นนำ ที่รองรับการเล่นทั้งบน มือถือ และ เดสก์ท็อป
จุดเด่น ของ pg slot
pg slot เป็นเกมสล็อตออนไลน์ที่ออกแบบมาให้ เปิดเกมได้ทันที เล่นผ่าน ระบบออนไลน์ และรองรับ ทุกแพลตฟอร์ม ไม่ต้องติดตั้งเพิ่มเติม ผู้เล่นสามารถเข้าเล่นผ่าน เว็บเบราว์เซอร์ ได้ทันที ภาพและเสียงถูกพัฒนาในรูปแบบ 3D ให้ความคมชัด พร้อมเอฟเฟกต์ สมจริง
คุณสมบัติหลักของเกม สล็อต PG ได้แก่
มีรอบโบนัสให้ลุ้นบ่อย
Multiplier
เล่นฟรีก่อนเติมเงิน
ใช้งานภาษาไทยง่าย
ระบบการเงินรวดเร็ว ทันใจ
แพลตฟอร์ม pg slot มักมี การฝาก-ถอน ออโต้ตลอด 24 ชม. ขั้นต่ำเริ่มต้นเพียง 10 บาท ขึ้นอยู่กับ กติกาแต่ละแพลตฟอร์ม การทำรายการใช้เวลา เพียงไม่กี่วินาที ผ่าน คิวอาร์โค้ด หรือระบบ ธนาคารบนมือถือ ทำให้ธุรกรรมเป็นไปอย่าง ต่อเนื่อง
แนวเกมที่คนเล่นเยอะ ใน PG Slot
เกม pg slot มีธีมหลากหลาย เช่น
ธีม เทพเจ้า
ธีม ลุยด่าน
ธีม เอเชียและโชคลาภ
ธีม สัตว์และธรรมชาติ
หลายคนชอบเกมที่โบนัสเข้าไว พร้อมระบบ โบนัสรอบพิเศษ และ โอกาสทำกำไรสูง เหมาะกับทั้ง คนเพิ่งเล่น และ สายสล็อตจริงจัง
ความน่าเชื่อถือ
PG Slot พัฒนาในระบบสากล มีการ ปกป้องข้อมูลผู้เล่น และใช้ระบบสุ่มผล RNG เพื่อให้ผลลัพธ์ ยุติธรรม แพลตฟอร์มที่ให้บริการ สล็อต PG ควรมี ระบบดูแลข้อมูล
บทสรุปท้ายบท
PG Slot เป็นตัวเลือกยอดนิยมสำหรับผู้ที่ต้องการเล่นสล็อตออนไลน์ ด้วยจุดเด่นด้าน โบนัสหลากหลาย และการทำธุรกรรมที่ ทันใจ ผู้เล่นสามารถเริ่มต้นได้ ทันที ฝากถอนสะดวก และเลือกเกมได้ จำนวนมาก เหมาะสำหรับ ทั้งมือใหม่และมือโปร ในโลกของเกมสล็อตออนไลน์
https://medium.com/@ratypw/ทดลองเล่นสล็อต-pg-70cdb1132344
ทดลองเล่นสล็อต pg ฟรี pg slot สล็อตยอดฮิต เข้าเล่นไว ฝากถอนออโต้
คำค้นหา สล็อต PG มาแรงในช่วงนี้ ในกลุ่มผู้เล่นเกมสล็อตออนไลน์ เพราะเป็น แบรนด์เกมที่โดดเด่น ด้าน งานภาพคุณภาพสูง ความ เสถียร และ ระบบจ่ายที่ดึงดูด เกมของ PG ผลิตโดยค่ายมาตรฐาน ที่รองรับการเล่นทั้งบน สมาร์ทโฟน และ เดสก์ท็อป
ข้อดี ของ สล็อต PG
PG Slot เป็นเกมสล็อตออนไลน์ที่ออกแบบมาให้ โหลดเร็ว เล่นผ่าน ระบบอัตโนมัติ และรองรับ ทั้ง iOS และ Android ไม่ต้องดาวน์โหลดแอป ผู้เล่นสามารถเข้าเล่นผ่าน เว็บเบราว์เซอร์ ได้ทันที ภาพและเสียงถูกพัฒนาในรูปแบบ สามมิติ ให้ความคมชัด พร้อมเอฟเฟกต์ สมจริง
คุณสมบัติหลักของเกม สล็อต PG ได้แก่
โบนัสและฟรีสปินหลายแบบ
ฟีเจอร์ตัวคูณรางวัล
เดโม่ฟรี
มีเมนูภาษาไทย
ฝากถอนง่าย ทำรายการไว
แพลตฟอร์ม สล็อต PG ส่วนใหญ่รองรับ การฝาก-ถอน ฝากถอนตลอดเวลา ขั้นต่ำเริ่มต้นเพียง 1 บาท ขึ้นอยู่กับ กติกาแต่ละแพลตฟอร์ม การทำรายการใช้เวลา ไม่กี่วินาที ผ่าน คิวอาร์โค้ด หรือระบบ แอปธนาคาร ทำให้ธุรกรรมเป็นไปอย่าง ต่อเนื่อง
แนวเกมที่คนเล่นเยอะ ใน PG Slot
เกม PG Slot มีธีมหลากหลาย เช่น
ธีม เทพเจ้า
ธีม ลุยด่าน
ธีม เอเชียและโชคลาภ
ธีม ธรรมชาติ
หลายคนชอบเกมที่โบนัสเข้าไว พร้อมระบบ Special Feature และ ระบบจ่ายคุ้มค่า เหมาะกับทั้ง มือใหม่ และ สายสล็อตจริงจัง
มาตรฐานระบบ
สล็อต PG มีมาตรฐานรองรับ มีการ รักษาความปลอดภัย และใช้ระบบสุ่มผล Random Number Generator เพื่อให้ผลลัพธ์ ยุติธรรม แพลตฟอร์มที่ให้บริการ สล็อต PG ควรมี ความปลอดภัยสูง
บทสรุปท้ายบท
สล็อต PG เป็นตัวเลือกยอดนิยมสำหรับผู้ที่ต้องการเล่นสล็อตออนไลน์ ด้วยจุดเด่นด้าน ระบบลื่นไหล และการทำธุรกรรมที่ รวดเร็ว ผู้เล่นสามารถเริ่มต้นได้ ง่าย ฝากถอนสะดวก และเลือกเกมได้ จำนวนมาก เหมาะสำหรับ ทั้งมือใหม่และมือโปร ในโลกของเกมสล็อตออนไลน์
pg slot เกมสล็อตออนไลน์ที่คนค้นหาเยอะ ใช้งานง่าย ฝากถอนรวดเร็ว
คำค้นหา สล็อต PG ถูกค้นหามากขึ้นเรื่อยๆ ในกลุ่มผู้เล่นเกมสล็อตออนไลน์ เพราะเป็น ผู้ให้บริการเกมสล็อตที่มาแรง ด้าน กราฟิก ความ ลื่นไหล และ โอกาสรับกำไรที่ดี เกมของ PG ผลิตโดยค่ายมาตรฐาน ที่รองรับการเล่นทั้งบน มือถือ และ เดสก์ท็อป
ข้อดี ของ PG Slot
PG Slot เป็นเกมสล็อตออนไลน์ที่ออกแบบมาให้ เข้าเกมไว เล่นผ่าน ระบบเว็บ และรองรับ ทั้ง iOS และ Android ไม่ต้องติดตั้งเพิ่มเติม ผู้เล่นสามารถเข้าเล่นผ่าน เว็บเบราว์เซอร์ ได้ทันที ภาพและเสียงถูกพัฒนาในรูปแบบ สามมิติ ให้ความคมชัด พร้อมเอฟเฟกต์ จัดเต็ม
คุณสมบัติหลักของเกม สล็อต PG ได้แก่
ระบบโบนัสและฟรีสปินหลากหลายรูปแบบ
Multiplier
เล่นฟรีก่อนเติมเงิน
รองรับภาษาไทยเต็มรูปแบบ
ระบบการเงินรวดเร็ว ทันใจ
แพลตฟอร์ม PG Slot โดยทั่วไปให้บริการ การฝาก-ถอน ฝากถอนตลอดเวลา ขั้นต่ำเริ่มต้นเพียง 1 บาท ขึ้นอยู่กับ ระบบของผู้ให้บริการ การทำรายการใช้เวลา รวดเร็วมาก ผ่าน QR Code หรือระบบ แอปธนาคาร ทำให้ธุรกรรมเป็นไปอย่าง ต่อเนื่อง
แนวเกมที่คนเล่นเยอะ ใน pg slot
เกม PG Slot มีธีมหลากหลาย เช่น
ธีม เทพเจ้า
ธีม Adventure
ธีม โชคลาภ
ธีม Animal
หลายคนชอบเกมที่โบนัสเข้าไว พร้อมระบบ โบนัสรอบพิเศษ และ โอกาสทำกำไรสูง เหมาะกับทั้ง คนเพิ่งเล่น และ สายสล็อตจริงจัง
มาตรฐานระบบ
PG Slot พัฒนาในระบบสากล มีการ รักษาความปลอดภัย และใช้ระบบสุ่มผล ระบบสุ่มมาตรฐาน เพื่อให้ผลลัพธ์ โปร่งใส แพลตฟอร์มที่ให้บริการ สล็อต PG ควรมี ความปลอดภัยสูง
บทสรุปท้ายบท
pg slot เป็นตัวเลือกยอดนิยมสำหรับผู้ที่ต้องการเล่นสล็อตออนไลน์ ด้วยจุดเด่นด้าน โบนัสหลากหลาย และการทำธุรกรรมที่ ทันใจ ผู้เล่นสามารถเริ่มต้นได้ ไม่ซับซ้อน ฝากถอนสะดวก และเลือกเกมได้ ครบทุกหมวด เหมาะสำหรับ ทั้งมือใหม่และมือโปร ในโลกของเกมสล็อตออนไลน์
https://medium.com/@ratypw/ทดลองเล่นสล็อต-pg-70cdb1132344
ทดลองเล่นสล็อต pg เว็บ ตรง”
pg slot แพลตฟอร์มเกมสล็อตยอดนิยม เล่นง่าย ฝากถอนเร็ว
คำค้นหา pg slot ถูกค้นหามากขึ้นเรื่อยๆ ในกลุ่มผู้เล่นเกมสล็อตออนไลน์ เพราะเป็น แบรนด์เกมที่โดดเด่น ด้าน งานภาพคุณภาพสูง ความ เสถียร และ อัตราการจ่ายรางวัลที่น่าสนใจ เกมของ PG พัฒนาโดยผู้ให้บริการชั้นนำ ที่รองรับการเล่นทั้งบน โทรศัพท์มือถือ และ เดสก์ท็อป
ความโดดเด่น ของ PG Slot
pg slot เป็นเกมสล็อตออนไลน์ที่ออกแบบมาให้ โหลดเร็ว เล่นผ่าน ระบบออนไลน์ และรองรับ ทุกอุปกรณ์ ไม่ต้องดาวน์โหลดแอป ผู้เล่นสามารถเข้าเล่นผ่าน เว็บเบราว์เซอร์ ได้ทันที ภาพและเสียงถูกพัฒนาในรูปแบบ สามมิติ ให้ความคมชัด พร้อมเอฟเฟกต์ จัดเต็ม
คุณสมบัติหลักของเกม สล็อต PG ได้แก่
มีรอบโบนัสให้ลุ้นบ่อย
ระบบตัวคูณ
เดโม่ฟรี
รองรับภาษาไทยเต็มรูปแบบ
ระบบการเงินรวดเร็ว ไม่ต้องรอนาน
แพลตฟอร์ม สล็อต PG โดยทั่วไปให้บริการ การฝาก-ถอน ออโต้ตลอด 24 ชม. ขั้นต่ำเริ่มต้นเพียง 1 บาท ขึ้นอยู่กับ เงื่อนไขของเว็บไซต์ การทำรายการใช้เวลา เพียงไม่กี่วินาที ผ่าน QR Code หรือระบบ แอปธนาคาร ทำให้ธุรกรรมเป็นไปอย่าง ต่อเนื่อง
แนวเกมที่คนเล่นเยอะ ใน pg slot
เกม สล็อต PG มีธีมหลากหลาย เช่น
ธีม เทพเจ้าและแฟนตาซี
ธีม Adventure
ธีม โชคลาภ
ธีม Animal
เกมยอดนิยมมักเป็นเกมที่แตกง่าย พร้อมระบบ โบนัสรอบพิเศษ และ อัตราการจ่ายที่สูง เหมาะกับทั้ง ผู้เล่นเริ่มต้น และ ผู้เล่นมือโปร
ความปลอดภัย
สล็อต PG พัฒนาในระบบสากล มีการ ปกป้องข้อมูลผู้เล่น และใช้ระบบสุ่มผล ระบบสุ่มมาตรฐาน เพื่อให้ผลลัพธ์ โปร่งใส แพลตฟอร์มที่ให้บริการ สล็อต PG ควรมี ระบบดูแลข้อมูล
สรุป
สล็อต PG เป็นตัวเลือกยอดนิยมสำหรับผู้ที่ต้องการเล่นสล็อตออนไลน์ ด้วยจุดเด่นด้าน ระบบลื่นไหล และการทำธุรกรรมที่ รวดเร็ว ผู้เล่นสามารถเริ่มต้นได้ ทันที ฝากถอนสะดวก และเลือกเกมได้ ครบทุกหมวด เหมาะสำหรับ ผู้เล่นทุกสไตล์ ในโลกของเกมสล็อตออนไลน์
ทดลองเล่นสล็อต pg ไม่ เด้ง
pg
แพลตฟอร์ม TKBNEKO พาคุณสู่โลกใหม่ของเกมเดิมพันออนไลน์ ระบบการเงินรวดเร็ว ด้วยระบบสแกน QR Code
ในยุคที่ นวัตกรรมดิจิทัลเข้ามาปรับโฉมวงการเกมออนไลน์ TKBNEKO ขอเป็นส่วนหนึ่งในการปฏิวัติวงการเกม ด้วยระบบการให้บริการที่ อัปเดตตลอดเวลา ฉับไว และ โปร่งใส พร้อมต้อนรับสมาชิกทุกท่านสู่ โลกแห่งเกมที่เหนือกว่าเดิม ที่ เปิดโอกาสให้ทุกคนสร้างรายได้
ทำไมต้อง TKBNEKO?
แพลตฟอร์มของเรารวบรวมเกมที่ได้มาตรฐาน โดยเฉพาะเกมที่ ผ่านการรับรองจากสถาบันที่น่าเชื่อถือ และ เป็นที่นิยมในระดับสากล เพื่อให้ผู้เล่นทุกคน สบายใจ ได้ว่า จะได้รับความเพลิดเพลินกับเกมที่ โปร่งใส ปลอดภัย และ มีคุณภาพสูง
ระบบการเงินที่เหนือกว่า
เรามุ่งเน้นความสะดวกของผู้เล่น เพื่อให้คุณ เล่นเกมได้แบบไม่สะดุด
ฝากขั้นต่ำ: เริ่มต้นเพียง 1 บาท
ถอนขั้นต่ำ: ขั้นต่ำ 1 บาท
เวลาฝากเงิน: รวดเร็วทันใจใน 3 วินาที
ยอดจำกัดการถอน: ไม่มียอดจำกัดต่อวัน
เติมเงินง่ายด้วย QR Code
เพียงคุณสแกน QR Code ระบบของเราจะ โอนเงินเข้าระบบทันที ขั้นต่ำเพียง เริ่มต้น 100 บาท และสามารถฝากได้สูงถึง 500,000 บาท เริ่มต้นได้ทันที กับ TKBNEKO ที่ ตอบโจทย์การเดิมพันยุคใหม่
หมวดหมู่เกมที่ครบครัน
TKBNEKO รวมเกมสุดฮิตไว้ในที่เดียว รองรับทุกความชอบของผู้เล่น
สล็อต: ธีมมากมาย พร้อมลุ้นรางวัลใหญ่
เกมสด: เล่นสดเหมือนอยู่ในคาสิโนจริง
กีฬา: เดิมพันกับแมตช์การแข่งขันจากทั่วโลก
ยิงปลา: เกมยิงปลาสุดมันส์ ได้เงินจริง
ติดตามโปรโมชั่นและสิทธิพิเศษ
อย่าลืมแวะมาเยี่ยมชมที่หน้า โปรโมชั่น เพื่อรับ สิทธิพิเศษมากมาย ที่เรามอบให้สมาชิกทุกท่าน นอกจากนี้ยังมีระบบ VIP สำหรับลูกค้าคนสำคัญ และช่องทาง แอฟฟิลิเอต สำหรับผู้ที่สนใจสร้างรายได้ร่วมกับเรา
ติดต่อเรา
หากมี ข้อสงสัย หรือ ข้อเสนอแนะ สามารถติดต่อทีมงานของเราได้ตลอด 24 ชั่วโมงที่หน้า ติดต่อเรา และ ข้อเสนอแนะ ทีมงาน ของเรา ยินดีให้บริการทุกท่านด้วยใจ
สล็อต
แพลตฟอร์ม TKBNEKO เปิดประสบการณ์ใหม่แห่งการเดิมพันออนไลน์ ธุรกรรมรวดเร็ว ด้วยระบบสแกน QR Code
ในยุคดิจิทัลที่ เทคโนโลยีพัฒนาอย่างรวดเร็ว เรามุ่งเน้นมาตรฐานใหม่ของการเดิมพัน ด้วยระบบที่ ล้ำสมัย รวดเร็ว และ โปร่งใส เพื่อให้ผู้เล่น อุ่นใจ ทุกครั้งที่ใช้งาน
ระบบการเงินที่ใช้งานง่าย
ฝากขั้นต่ำ: เริ่มต้น 1 บาท
ถอนขั้นต่ำ: 1 บาท
เวลาฝากเงิน: ใช้เวลาเพียง 3 วินาที
ยอดถอน: ไม่จำกัดต่อวัน
เติมเงินง่าย แค่สแกน
สแกน QR Code ระบบจะ โอนเงินเข้าทันที ขั้นต่ำ เริ่ม 100 บาท สูงสุด ไม่เกิน 500,000 บาทต่อครั้ง
หมวดหมู่เกม
สล็อต: ธีมหลากหลาย
เกมสด: ดีลเลอร์สด
กีฬา: เดิมพันลีกดัง
ยิงปลา: ลุ้นกำไรทันที
โปรโมชั่นและสิทธิพิเศษ
ติดตามหน้า โบนัส พร้อมระบบ VIP และโปรแกรม แอฟฟิลิเอต
ติดต่อเรา
สอบถามข้อมูลได้ตลอด 24 ชั่วโมง ผ่านหน้า ศูนย์ช่วยเหลือ ทีมงาน TKBNEKO พร้อมดูแลตลอดเวลา
สล็อต PG เกมสล็อตออนไลน์ที่คนค้นหาเยอะ เข้าเล่นไว ฝากถอนออโต้
คำค้นหา pg slot กำลังได้รับความนิยมอย่างต่อเนื่อง ในกลุ่มผู้เล่นเกมสล็อตออนไลน์ เพราะเป็น แบรนด์เกมที่โดดเด่น ด้าน งานภาพคุณภาพสูง ความ นิ่งไม่สะดุด และ โอกาสรับกำไรที่ดี เกมของ PG ออกแบบโดยทีมงานมืออาชีพ ที่รองรับการเล่นทั้งบน โทรศัพท์มือถือ และ พีซี
ข้อดี ของ pg slot
pg slot เป็นเกมสล็อตออนไลน์ที่ออกแบบมาให้ เปิดเกมได้ทันที เล่นผ่าน ระบบเว็บ และรองรับ ทั้ง iOS และ Android ไม่ต้องดาวน์โหลดแอป ผู้เล่นสามารถเข้าเล่นผ่าน หน้าเว็บ ได้ทันที ภาพและเสียงถูกพัฒนาในรูปแบบ สามมิติ ให้ความคมชัด พร้อมเอฟเฟกต์ จัดเต็ม
คุณสมบัติหลักของเกม สล็อต PG ได้แก่
โบนัสและฟรีสปินหลายแบบ
Multiplier
โหมดทดลองเล่นฟรี
ใช้งานภาษาไทยง่าย
ระบบฝากถอนสะดวก ทันใจ
แพลตฟอร์ม สล็อต PG ส่วนใหญ่รองรับ การฝาก-ถอน อัตโนมัติ 24 ชั่วโมง ขั้นต่ำเริ่มต้นเพียง 10 บาท ขึ้นอยู่กับ กติกาแต่ละแพลตฟอร์ม การทำรายการใช้เวลา ไม่กี่วินาที ผ่าน สแกน QR หรือระบบ ธนาคารบนมือถือ ทำให้ธุรกรรมเป็นไปอย่าง ไม่สะดุด
แนวเกมที่คนเล่นเยอะ ใน PG Slot
เกม สล็อต PG มีธีมหลากหลาย เช่น
ธีม เทพเจ้า
ธีม ลุยด่าน
ธีม เอเชียและโชคลาภ
ธีม ธรรมชาติ
หลายคนชอบเกมที่โบนัสเข้าไว พร้อมระบบ ฟีเจอร์พิเศษ และ โอกาสทำกำไรสูง เหมาะกับทั้ง มือใหม่ และ ผู้เล่นที่มีประสบการณ์
ความปลอดภัย
pg slot พัฒนาในระบบสากล มีการ ปกป้องข้อมูลผู้เล่น และใช้ระบบสุ่มผล Random Number Generator เพื่อให้ผลลัพธ์ โปร่งใส แพลตฟอร์มที่ให้บริการ PG Slot ควรมี ความปลอดภัยสูง
บทสรุปท้ายบท
สล็อต PG เป็นตัวเลือกยอดนิยมสำหรับผู้ที่ต้องการเล่นสล็อตออนไลน์ ด้วยจุดเด่นด้าน ระบบลื่นไหล และการทำธุรกรรมที่ ไว ผู้เล่นสามารถเริ่มต้นได้ ทันที ฝากถอนสะดวก และเลือกเกมได้ ครบทุกหมวด เหมาะสำหรับ ทั้งมือใหม่และมือโปร ในโลกของเกมสล็อตออนไลน์
Автозайм
Деньги с обеспечением ПТС в городе Самара — это возможность получить средства под авто без необходимости продавать автомобиля и без долгих проверок банка. Основная особенность такого займа — транспорт продолжает оставаться у собственника, а в залог передаётся только ПТС. Это даёт возможность использовать автомобилем, пока действует договор займа.
Получение средств возможна в день обращения. Заявка рассматривается около 15 минут, после чего принимается ответ по сумме займа и условиям оформления. Сумма финансирования может достигать до 5 000 000 ?, а процентная ставка стартует от 2% в месяц. Срок кредитования обычно достигает до 60 месяцев, по этой причине клиент выбирает подходящий план платежей.
Процесс оформления заявки работает онлайн. Заёмщик заполняет форму, вносит данные автомобиля и желаемую сумму. После анализа данных приходит начальное решение. В большинстве случаев средства переводятся в тот же день, когда оформляется договор займа.
Для оценки условий используется калькулятор займа. Например, при сумме 300 000 ? на срок 12 месяцев платёж в месяц составит около 33 057 ?. Общая переплата по такому займу будет примерно 96 684 ?. Итоговые условия могут изменяться в зависимости оценки автомобиля и выбранного срока кредитования.
На страницах сервиса автозаймов часто отображается онлайн-лента заявок. Она показывает активность сервиса и примеры обработанных заявок из разных городов. Например, заявки на сумму 1 840 000 ? из Тулы, 1 890 000 ? город Москва или 1 470 000 ? из Челябинска могут получать статус «Одобрено». Часть заявок находятся на этапе проверки — например, 290 000 ? из Сочи или 720 000 ? из Екатеринбурга. Подобные разделы отображают текущую активность платформы и число обработанных заявок сегодня и в текущем месяце.
Автозайм с залогом ПТС может подойти людям, кому требуется быстро получить значительную сумму без продажи автомобиля. Основные параметры таких займов — ставка от 2% в месяц, рассмотрение примерно 15 минут, размер займа до 5 млн ? и вариант подать заявку онлайн. После отправки формы клиент ожидает решение, связаться через мессенджер или обратиться к менеджеру для уточнения деталей процедуры.
ทดลองเล่นสล็อต pg ไม่ เด้ง
Автозайм
Кредит под обеспечение ПТС в Самаре — представляет собой способ получить деньги под авто без продажи автомобиля и без долгих проверок банка. Ключевая особенность такого займа — транспорт продолжает оставаться у владельца, а в залог оформляется только ПТС. Это позволяет продолжать пользоваться автомобилем, пока действует договор займа.
Получение средств возможна в день подачи заявки. Заявка проверяется примерно за 15 минут, затем выносится ответ по сумме и условиям. Сумма финансирования может достигать до 5 000 000 ?, а ставка стартует от 2% в месяц. Срок кредитования как правило достигает до 60 месяцев, поэтому клиент может подобрать удобный график выплат.
Процесс оформления заявки доступна через интернет. Заёмщик заполняет форму, вносит данные автомобиля и необходимую сумму займа. После проверки документов выносится начальное одобрение. В большинстве случаев деньги выдаются в день оформления, после подписания договор.
Для расчёта параметров применяется калькулятор займа. К примеру, при сумме 300 000 ? на период 12 месяцев ежемесячный платёж составит примерно 33 057 ?. Общая переплата по такому займу будет примерно 96 684 ?. Конечные условия могут изменяться в зависимости от стоимости автомобиля и выбранного срока займа.
На сайтах автокредитования нередко показывается онлайн-лента заявок. Она демонстрирует активность системы и примеры обработанных заявок по разным городам. Например, заявки на суммы 1 840 000 ? из Тулы, 1 890 000 ? город Москва или 1 470 000 ? город Челябинск получают статус «Одобрено». Часть обращений находятся в стадии проверки — например, 290 000 ? город Сочи или 720 000 ? из Екатеринбурга. Подобные разделы показывают текущую активность сервиса и число заявок за день и в текущем месяце.
Автозайм под залог ПТС может подойти тем, кому нужно быстро получить значительную сумму без продажи автомобиля. Базовые условия подобного финансирования — ставка начиная от 2% в месяц, рассмотрение около 15 минут, размер займа до 5 млн ? и вариант подать заявку онлайн. После отправки формы заёмщик ожидает решение, написать в мессенджер или обратиться к менеджеру для уточнения деталей процедуры.
ทดลองเล่นสล็อต pg ฟรี pg slot แพลตฟอร์มเกมสล็อตยอดนิยม ใช้งานง่าย ฝากถอนรวดเร็ว
คำค้นหา PG Slot มาแรงในช่วงนี้ ในกลุ่มผู้เล่นเกมสล็อตออนไลน์ เพราะเป็น แบรนด์เกมที่โดดเด่น ด้าน งานภาพคุณภาพสูง ความ นิ่งไม่สะดุด และ อัตราการจ่ายรางวัลที่น่าสนใจ เกมของ PG ออกแบบโดยทีมงานมืออาชีพ ที่รองรับการเล่นทั้งบน มือถือ และ คอมพิวเตอร์
จุดเด่น ของ PG Slot
pg slot เป็นเกมสล็อตออนไลน์ที่ออกแบบมาให้ เปิดเกมได้ทันที เล่นผ่าน ระบบออนไลน์ และรองรับ ทั้ง iOS และ Android ไม่ต้องติดตั้งเพิ่มเติม ผู้เล่นสามารถเข้าเล่นผ่าน หน้าเว็บ ได้ทันที ภาพและเสียงถูกพัฒนาในรูปแบบ เอฟเฟกต์ 3 มิติ ให้ความคมชัด พร้อมเอฟเฟกต์ สมจริง
คุณสมบัติหลักของเกม pg slot ได้แก่
ระบบโบนัสและฟรีสปินหลากหลายรูปแบบ
ฟีเจอร์ตัวคูณรางวัล
เดโม่ฟรี
รองรับภาษาไทยเต็มรูปแบบ
ระบบฝากถอนสะดวก ทำรายการไว
แพลตฟอร์ม สล็อต PG มักมี การฝาก-ถอน ออโต้ตลอด 24 ชม. ขั้นต่ำเริ่มต้นเพียง 10 บาท ขึ้นอยู่กับ ระบบของผู้ให้บริการ การทำรายการใช้เวลา รวดเร็วมาก ผ่าน คิวอาร์โค้ด หรือระบบ แอปธนาคาร ทำให้ธุรกรรมเป็นไปอย่าง ต่อเนื่อง
แนวเกมที่คนเล่นเยอะ ใน pg slot
เกม PG Slot มีธีมหลากหลาย เช่น
ธีม แฟนตาซี
ธีม ผจญภัย
ธีม ความมั่งคั่ง
ธีม ธรรมชาติ
ผู้เล่นนิยมเกมที่มีรอบพิเศษบ่อย พร้อมระบบ Special Feature และ ระบบจ่ายคุ้มค่า เหมาะกับทั้ง มือใหม่ และ สายสล็อตจริงจัง
ความปลอดภัย
pg slot พัฒนาในระบบสากล มีการ ปกป้องข้อมูลผู้เล่น และใช้ระบบสุ่มผล ระบบสุ่มมาตรฐาน เพื่อให้ผลลัพธ์ ยุติธรรม แพลตฟอร์มที่ให้บริการ PG Slot ควรมี ความปลอดภัยสูง
โดยภาพรวม
สล็อต PG เป็นตัวเลือกยอดนิยมสำหรับผู้ที่ต้องการเล่นสล็อตออนไลน์ ด้วยจุดเด่นด้าน โบนัสหลากหลาย และการทำธุรกรรมที่ รวดเร็ว ผู้เล่นสามารถเริ่มต้นได้ ทันที ฝากถอนสะดวก และเลือกเกมได้ ครบทุกหมวด เหมาะสำหรับ ทั้งมือใหม่และมือโปร ในโลกของเกมสล็อตออนไลน์
rufus download Rufus is known as a compact, no-cost, open source utility created to create bootable USB drives. It helps users prepare a USB flash drive that can install an operating system, run diagnostic tools, or boot into a recovery environment. The program requires no installation and can be opened as soon as it is downloaded.
The primary purpose of Rufus is helping users to create bootable USB media from ISO images fast and reliably. This allows users to install or run operating systems directly from a USB flash drive without the need for DVDs. The tool supports a large number of operating systems and service utilities, which makes the program useful for both regular users and system administrators.
Rufus works on computers with Microsoft Windows, starting from Windows 7. Both 32-bit and 64-bit versions are supported, and there is also a version available for ARM64 architecture.
The software allows users to create bootable USB drives from many different ISO images. It can be used to prepare a USB drive for installing Windows 11, Windows 10, Windows 8.1, or Windows 7, as well as various Linux distributions. Rufus also works with DOS systems and other recovery or maintenance tools commonly used for troubleshooting computers.
One of the included features of Rufus is the ability to download official Windows ISO images directly from Microsoft servers. This allows users to obtain original installation images for Windows 8.1, Windows 10, and Windows 11 without searching for them on third-party websites.
In addition to creating bootable drives, Rufus can format USB devices. It supports several file systems including FAT32, NTFS, exFAT, UDF, and ReFS. This flexibility allows the USB drive to be prepared for different use cases and compatibility requirements.
Rufus supports both legacy BIOS systems and modern UEFI environments. Because of this, bootable drives created with Rufus can work on older computers as well as newer systems that use UEFI and Secure Boot.
Another feature included in Rufus is Windows To Go support. This option allows users to run a full Windows environment directly from a USB drive. It can be useful for testing systems, performing maintenance, or working on multiple computers without installing Windows on the internal drive.
Rufus also provides the option to bypass certain Windows 11 installation requirements. When creating an installation USB, the program can disable checks for TPM 2.0, Secure Boot, and minimum RAM requirements. This makes it possible to install Windows 11 on computers that would otherwise not meet the official hardware requirements.
One of the reasons Rufus has become popular is its speed and simplicity. The program is extremely small, about 1.9 MB in size, and runs as a portable application without installation. It is distributed under the GPL v3 open-source license, supports more than 70 languages, and contains no advertisements, bundled software, or tracking components.
Rufus works with a large number of ISO images. These include multiple versions of Windows, Windows Server editions, FreeDOS, and various system tools such as GParted, Hiren’s Boot CD, Parted Magic, and Clonezilla. Because of this wide compatibility, the program can be used not only for installing operating systems but also for disk management, data recovery, and system maintenance tasks.
To use Rufus, a computer running Windows 7 or later and a USB flash drive are required. The program does not need to be installed. Users simply download the executable file, run it, select the ISO image they want to use, and create a bootable USB drive. Due to its simplicity, speed, and reliability, Rufus remains one of the most widely used tools for creating bootable USB drives.
PG Slot เกมสล็อตออนไลน์ที่คนค้นหาเยอะ เล่นง่าย ฝากถอนเร็ว
คำค้นหา pg slot ถูกค้นหามากขึ้นเรื่อยๆ ในกลุ่มผู้เล่นเกมสล็อตออนไลน์ เพราะเป็น แบรนด์เกมที่โดดเด่น ด้าน งานภาพคุณภาพสูง ความ ลื่นไหล และ ระบบจ่ายที่ดึงดูด เกมของ PG ผลิตโดยค่ายมาตรฐาน ที่รองรับการเล่นทั้งบน โทรศัพท์มือถือ และ เดสก์ท็อป
ความโดดเด่น ของ PG Slot
pg slot เป็นเกมสล็อตออนไลน์ที่ออกแบบมาให้ เข้าเกมไว เล่นผ่าน ระบบอัตโนมัติ และรองรับ ทั้ง iOS และ Android ไม่ต้องติดตั้งเพิ่มเติม ผู้เล่นสามารถเข้าเล่นผ่าน เว็บเบราว์เซอร์ ได้ทันที ภาพและเสียงถูกพัฒนาในรูปแบบ 3D ให้ความคมชัด พร้อมเอฟเฟกต์ สมจริง
คุณสมบัติหลักของเกม pg slot ได้แก่
ระบบโบนัสและฟรีสปินหลากหลายรูปแบบ
ฟีเจอร์ตัวคูณรางวัล
เดโม่ฟรี
ใช้งานภาษาไทยง่าย
ระบบฝากถอนสะดวก ทำรายการไว
แพลตฟอร์ม สล็อต PG มักมี การฝาก-ถอน ออโต้ตลอด 24 ชม. ขั้นต่ำเริ่มต้นเพียง หลักหน่วย ขึ้นอยู่กับ เงื่อนไขของเว็บไซต์ การทำรายการใช้เวลา เพียงไม่กี่วินาที ผ่าน QR Code หรือระบบ แอปธนาคาร ทำให้ธุรกรรมเป็นไปอย่าง ต่อเนื่อง
หมวดเกมฮิต ใน PG Slot
เกม pg slot มีธีมหลากหลาย เช่น
ธีม เทพเจ้าและแฟนตาซี
ธีม ลุยด่าน
ธีม ความมั่งคั่ง
ธีม สัตว์และธรรมชาติ
หลายคนชอบเกมที่โบนัสเข้าไว พร้อมระบบ โบนัสรอบพิเศษ และ ระบบจ่ายคุ้มค่า เหมาะกับทั้ง มือใหม่ และ ผู้เล่นมือโปร
มาตรฐานระบบ
สล็อต PG ใช้ระบบที่ได้มาตรฐาน มีการ ปกป้องข้อมูลผู้เล่น และใช้ระบบสุ่มผล ระบบสุ่มมาตรฐาน เพื่อให้ผลลัพธ์ ตรวจสอบได้ แพลตฟอร์มที่ให้บริการ PG Slot ควรมี ความปลอดภัยสูง
โดยภาพรวม
PG Slot เป็นตัวเลือกยอดนิยมสำหรับผู้ที่ต้องการเล่นสล็อตออนไลน์ ด้วยจุดเด่นด้าน กราฟิกคุณภาพ และการทำธุรกรรมที่ ทันใจ ผู้เล่นสามารถเริ่มต้นได้ ไม่ซับซ้อน ฝากถอนสะดวก และเลือกเกมได้ หลากหลายแนว เหมาะสำหรับ ทั้งมือใหม่และมือโปร ในโลกของเกมสล็อตออนไลน์
ทดลองเล่นสล็อต pg ไม่ เด้ง
мелбет казино скачать на андроид
Установить приложение Melbet: APK, iOS и ПК
Мобильная версия Melbet включает ставки и казино в одном интерфейсе. Доступны live-ставки, казино-игры, онлайн-трансляции, аналитика и операции по счёту. Загрузка занимает 1–2 минуты.
Android (APK)
Скачайте APK с официального сайта, откройте файл и завершите установку. При необходимости включите разрешение на установку из неизвестных источников, затем авторизуйтесь.
iOS (iPhone)
Откройте App Store, найдите «Melbet», выберите «Получить», после установки авторизуйтесь в системе.
ПК
Откройте официальный сайт, авторизуйтесь и добавьте ярлык на рабочий стол. Браузерная версия функционирует как полноценное приложение.
Функционал
Live-ставки с мгновенным обновлением линии, игровой раздел с тысячами игр, прямые трансляции, подробная статистика, уведомления о матчах, регистрация за минуту и поддержка 24/7.
Бонусы
После загрузки доступны бонус на первый депозит, акционные коды и бесплатные ставки. Условия зависят от региона.
Безопасность
Загружайте только с официального сайта, контролируйте адрес сайта, не передавайте пароль третьим лицам и активируйте двухфакторную аутентификацию.
Загрузка выполняется быстро, после чего доступен весь функционал Melbet.
bidik88
melbet скачать на компьютер
Скачать Melbet: APK, iOS и компьютер
Приложение Melbet включает букмекерскую контору и казино в одном интерфейсе. Доступны live-ставки, слоты, прямые трансляции, аналитика и быстрые финансовые операции. Установка занимает 1–2 минуты.
Android (APK)
Скачайте APK с официального сайта, запустите установщик и подтвердите установку. При необходимости включите разрешение на установку из неизвестных источников, затем авторизуйтесь.
iOS (iPhone)
Откройте App Store, найдите «Melbet», нажмите «Получить», после установки выполните вход.
ПК
Перейдите официальный сайт, войдите в личный кабинет и добавьте ярлык на рабочий стол. Браузерная версия функционирует как отдельное приложение.
Функционал
Live-ставки с обновлением коэффициентов, игровой раздел с тысячами игр, просмотр матчей, аналитические данные, push-оповещения, регистрация за минуту и поддержка 24/7.
Бонусы
После загрузки доступны приветственный бонус, промокоды и фрибеты. Правила начисления определяются регионом.
Безопасность
Загружайте только с официальных источников, проверяйте домен, не передавайте пароль третьим лицам и включите 2FA.
Установка занимает несколько минут, после чего открывается полный доступ Melbet.
+1 to this, same experience here with heap o wins, really solid stuff.
https://okbolt.co.kr/bbs/board.php?bo_table=free&wr_id=332146
леон зеркало скачать
джойказино вход
has anyone here tried 777bet yet? im thinking about making an account but id like to hear what u guys think first, is it legit or nah? reccomend it?
I wanted to share my experience with ipl live cricket. I have been using the site for about a month and I must say the overall quality is quite good. Everything functions properly and I would recommend it to anyone interested.
slot online
Honestly, if you like card games at all you should just try it already. free rummy card games
Good day everyone. I felt compelled to share my thoughts regarding this particular platform after several weeks of use. The layout is intuitive, the performance is reliable, and the support team has been quite responsive to my inquiries. Should you find yourself searching for an alternative, [url=https://tk88casino.net/]tk88 mvp[/url] may warrant your attention. Cheers.
So my friend told me about this site last month and I was sceptical at first, but I decided to check out [url=https://777-bet.it.com/]777 bit[/url] and honestly its way more intuative than I thought it would be, really clean design and everything loads fast which is nice.
We are a group of volunteers and opening a new scheme in our community. Your website provided us with valuable info to work on. You have done a formidable job and our entire community will be thankful to you.
Hello, Neat post. There is a problem together with your web site in web explorer, may test this? IE still is the market leader and a good component of other people will leave out your fantastic writing because of this problem.
I am extremely impressed with your writing skills as well as with the layout on your weblog. Is this a paid theme or did you customize it yourself? Anyway keep up the nice quality writing, it is rare to see a nice blog like this one today..
Hello There. I found your blog using msn. This is a really well written article. I will make sure to bookmark it and come back to read more of your useful info. Thanks for the post. I?ll definitely comeback.
Magnificent web site. Lots of helpful information here. I?m sending it to several buddies ans additionally sharing in delicious. And naturally, thanks in your sweat!
Thank you for any other informative website. Where else may I am getting that kind of info written in such an ideal manner? I have a mission that I’m simply now working on, and I have been on the glance out for such info.
I have observed that in digital camera models, extraordinary detectors help to {focus|concentrate|maintain focus|target|a**** automatically. These sensors regarding some cameras change in in the area of contrast, while others use a beam of infra-red (IR) light, especially in low lumination. Higher specification cameras from time to time use a blend of both systems and will often have Face Priority AF where the camera can ‘See’ the face and concentrate only in that. Thank you for sharing your notions on this website.
Hello there! This is my first visit to your blog! We are a team of volunteers and starting a new project in a community in the same niche. Your blog provided us beneficial information to work on. You have done a wonderful job!
Wow! I’m in awe of the author’s writing skills and capability to convey intricate concepts in a clear and clear manner. This article is a real treasure that earns all the applause it can get. Thank you so much, author, for sharing your knowledge and offering us with such a precious resource. I’m truly appreciative!
I have learned several important things through your post. I’d also like to express that there will be a situation in which you will make application for a loan and never need a co-signer such as a Federal Student Support Loan. But if you are getting a loan through a conventional loan company then you need to be made ready to have a co-signer ready to enable you to. The lenders will probably base that decision on the few variables but the largest will be your credit history. There are some loan merchants that will also look at your work history and make up your mind based on this but in almost all cases it will hinge on your credit score.
Thanks for your post here. One thing I’d like to say is that often most professional domains consider the Bachelor Degree just as the entry level requirement for an online education. Even though Associate Diplomas are a great way to begin with, completing the Bachelors opens up many doorways to various careers, there are numerous online Bachelor Course Programs available by institutions like The University of Phoenix, Intercontinental University Online and Kaplan. Another thing is that many brick and mortar institutions offer Online variations of their certifications but typically for a substantially higher cost than the organizations that specialize in online course plans.
?Levantemos nuestros brindis por cada amante de la adrenalina !
–
?Que la fortuna avance contigo con instantes increibles conquistas unicas !
Great blog! Is your theme custom made or did you download it from somewhere? A design like yours with a few simple tweeks would really make my blog stand out. Please let me know where you got your design. Many thanks
Hey There. I found your blog using msn. This is a very well written article. I?ll be sure to bookmark it and return to read more of your useful information. Thanks for the post. I will certainly return.
I?ve been exploring for a little bit for any high quality articles or blog posts on this kind of area . Exploring in Yahoo I at last stumbled upon this web site. Reading this information So i am happy to convey that I have an incredibly good uncanny feeling I discovered exactly what I needed. I most certainly will make sure to do not forget this site and give it a look on a constant basis.
affordablecanvaspaintings.com.au is Australia Popular Online 100 percent Handmade Art Store. We deliver Budget Handmade Canvas Paintings, Abstract Art, Oil Paintings, Artwork Sale, Acrylic Wall Art Paintings, Custom Art, Oil Portraits, Pet Paintings, Building Paintings etc. 1000+ Designs To Choose From, Highly Experienced Artists team, Up-to 50 percent OFF SALE and FREE Delivery Australia, Sydney, Melbourne, Brisbane, Adelaide, Hobart and all regional areas. We ship worldwide international locations. Order Online Your Handmade Art Today.
wonderful points altogether, you simply gained a brand new reader. What would you recommend about your post that you made a few days ago? Any positive?
Hey! I’m at work surfing around your blog from my new iphone 3gs! Just wanted to say I love reading your blog and look forward to all your posts! Carry on the excellent work!
Thanks for your submission. I would love to comment that the first thing you will need to carry out is verify if you really need credit score improvement. To do that you simply must get your hands on a copy of your credit rating. That should not be difficult, since government makes it necessary that you are allowed to acquire one free of charge copy of your credit report annually. You just have to consult the right men and women. You can either find out from the website for your Federal Trade Commission or contact one of the leading credit agencies specifically.
I have observed that wise real estate agents just about everywhere are warming up to FSBO ***********. They are recognizing that it’s not just placing a sign in the front place. It’s really concerning building interactions with these dealers who someday will become purchasers. So, whenever you give your time and effort to assisting these vendors go it alone — the “Law connected with Reciprocity” kicks in. Great blog post.
Thanks for giving your ideas. The one thing is that scholars have an option between federal student loan as well as a private student loan where it truly is easier to select student loan debt consolidation than with the federal education loan.
This is undoubtedly one of the best articles I’ve read on this topic! The author’s extensive knowledge and passion for the subject shine through in every paragraph. I’m so appreciative for coming across this piece as it has enhanced my understanding and stimulated my curiosity even further. Thank you, author, for investing the time to create such a phenomenal article!
Howdy! Do you use Twitter? I’d like to follow you if that would be ok. I’m undoubtedly enjoying your blog and look forward to new updates.
It?s truly a nice and helpful piece of info. I?m happy that you shared this helpful info with us. Please stay us informed like this. Thank you for sharing.
Hi there, simply turned into alert to your blog thru Google, and located that it is truly informative. I am gonna be careful for brussels. I?ll be grateful in case you proceed this in future. Numerous other people will probably be benefited out of your writing. Cheers!
medhair
mehmet
aslı
aslı
dr saban
smile
hairneva
güncel
sapphire
aslı
güncel
sapphire
Hello! I know this is kinda off topic however , I’d figured I’d ask. Would you be interested in exchanging links or maybe guest writing a blog post or vice-versa? My site covers a lot of the same subjects as yours and I think we could greatly benefit from each other. If you’re interested feel free to send me an e-mail. I look forward to hearing from you! Excellent blog by the way!
medhair
smile
hairneva
sapphire
hekimoğlu
My brother suggested I might like this website. He was entirely right. This post actually made my day. You can not imagine simply how much time I had spent for this info! Thanks!
My partner and I absolutely love your blog and find many of your post’s to be what precisely I’m looking for. Would you offer guest writers to write content to suit your needs? I wouldn’t mind composing a post or elaborating on a few of the subjects you write about here. Again, awesome web log!
Looking for the Best Drive School of Motoring? Get expert driving lessons at best driving school for affordable and quality driving instruction.
It’s perfect time to make some plans for the future and it’s time to be happy. I’ve read this post and if I could I want to suggest you few interesting things or tips. Perhaps you can write next articles referring to this article. I wish to read even more things about it!
Thanks for the write-up. My spouse and i have often seen that a lot of people are desirous to lose weight because they wish to appear slim plus attractive. Having said that, they do not usually realize that there are more benefits just for losing weight additionally. Doctors state that over weight people come across a variety of health conditions that can be directly attributed to their own excess weight. The good news is that people who definitely are overweight and suffering from a variety of diseases are able to reduce the severity of the illnesses through losing weight. You possibly can see a progressive but marked improvement with health if even a moderate amount of weight-loss is attained.
I just couldn’t depart your web site before suggesting that I extremely enjoyed the standard info a person provide for your visitors? Is going to be back often in order to check up on new posts
UpvoteRocket is an automated vote delivery service for game server toplist websites. Buy votes for 25+ supported ranking sites including XtremeTop100, GTop100, TopG, MMtop200 and more. Real mobile proxy IPs, pay per vote, instant campaign setup.
Amazing! This blog looks just like my old one! It’s on a entirely different topic but it has pretty much the same layout and design. Superb choice of colors!
The crux of your writing while appearing reasonable at first, did not really work properly with me personally after some time. Someplace within the paragraphs you were able to make me a believer but only for a while. I nevertheless have got a problem with your jumps in logic and you would do nicely to help fill in those gaps. In the event you actually can accomplish that, I could surely end up being impressed.
UpvoteRocket is the #1 automated voting service for private MMORPG servers. Climb toplist rankings on XtremeTop100, TopG, GTop100 with smart undetectable automation. Ragnarok, WoW, Mu Online & 20+ platforms supported. Pay only for delivered votes.
Its like you read my mind! You appear to know so much about this, like you wrote the book in it or something. I think that you can do with a few pics to drive the message home a bit, but other than that, this is fantastic blog. An excellent read. I’ll certainly be back.
Hey there! Do you know if they make any plugins to protect against hackers? I’m kinda paranoid about losing everything I’ve worked hard on. Any suggestions?
Hi there very cool website!! Guy .. Beautiful .. Amazing .. I’ll bookmark your site and take the feeds also?I am satisfied to search out numerous useful info right here in the put up, we’d like work out extra techniques on this regard, thank you for sharing. . . . . .
I have read several good stuff here. Certainly worth bookmarking for revisiting. I wonder how a lot attempt you place to make such a wonderful informative website.
I have really learned result-oriented things through your blog site. One other thing I would really like to say is the fact that newer laptop os’s are likely to allow more memory to be played with, but they furthermore demand more memory simply to run. If one’s computer cannot handle far more memory and the newest program requires that memory increase, it can be the time to shop for a new PC. Thanks