Key Takeaways:
- DOT price is attempting a crucial upside break above the $6.60 resistance.
- A major bullish trend line is forming with support near $6.20 on the daily chart.
- The current price action suggests high chances of an upside break above the $6.60 resistance.

Polkadot’s DOT is trading above the $6.20 support and the 50-day SMA. The price is rising and it may soon surge toward the $7.10 resistance zone.
Polkadot’s DOT Price Eyes Bullish Breakout
After tagging the $5.15 support, DOT price started a decent increase against the US Dollar. The price was able to recover above the $5.50 and $5.60 resistance levels.
However, DOT failed to gain as much as Bitcoin and Ethereum. It is still facing strong resistance near the $6.55 and $6.60 levels. The stated resistance is near the 50% Fib retracement level of the main decline from the $7.88 swing high to the $5.15 low.
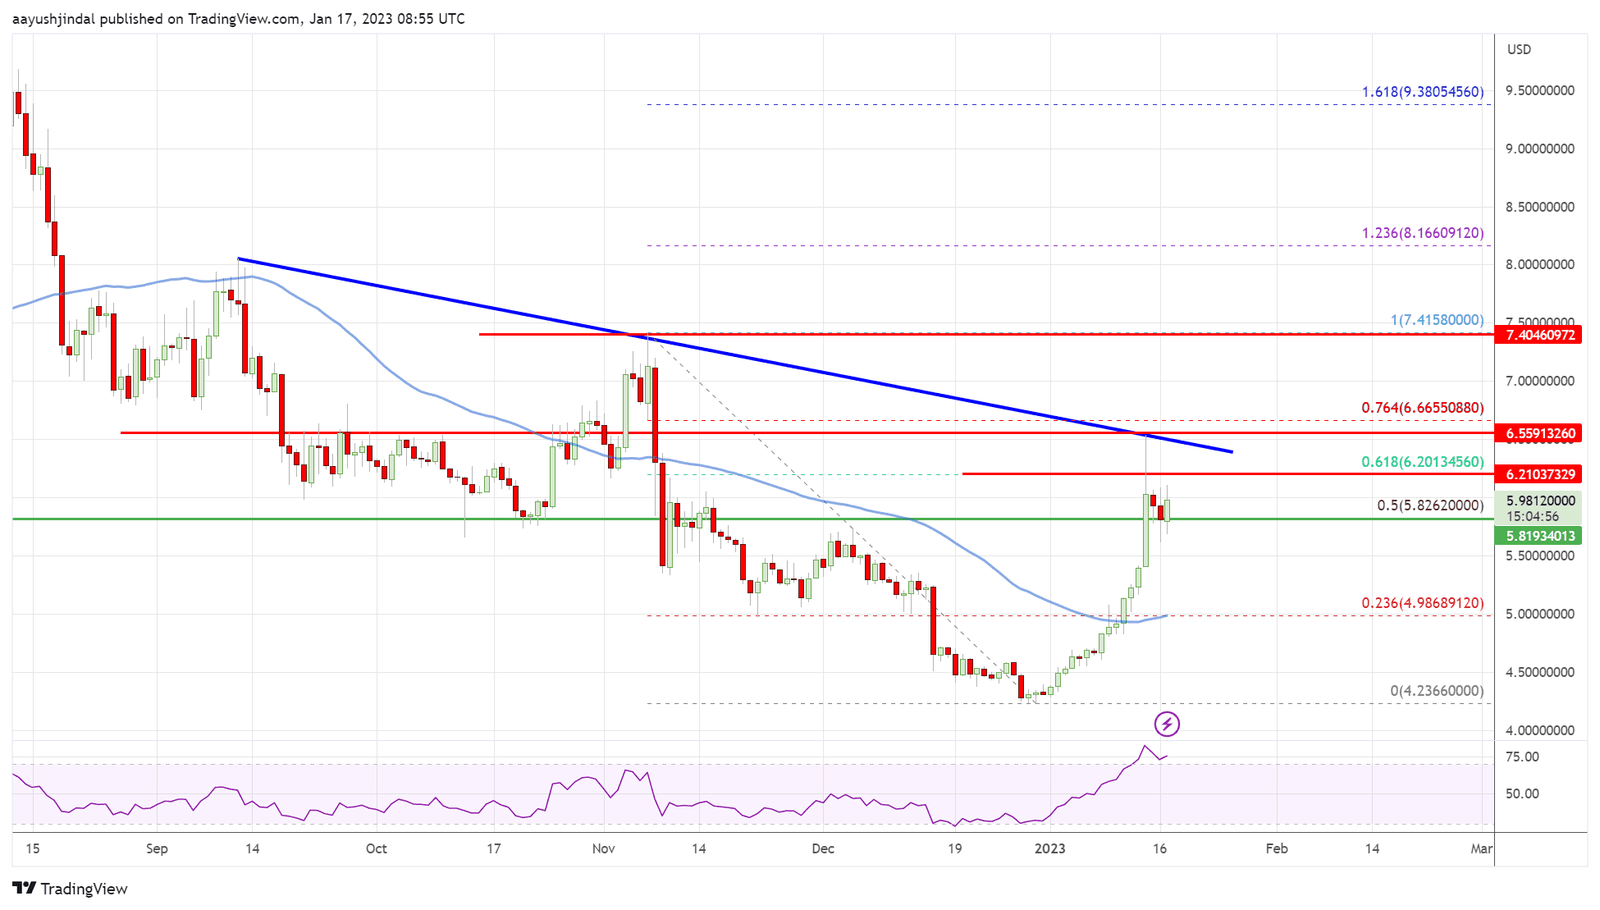
Polkadot’s price daily chart | Source: DOTUSD on TradingView.com
Looking at the chart, it seems like the price managed to settle above the $6.20 support and the 50-day simple moving average (blue).
Therefore, there are high chances of an upside break above the $6.60 resistance zone. If there is a close above the $6.60 resistance, DOT might surge 15%-25%. The next major resistance is near the $7.25 level or the 76.4% Fib retracement level of the main decline from the $7.88 swing high to the $5.15 low.
A clear wave above the $7.25 level could send the price toward the $8.00 resistance. Any more gains might open the doors for a move toward the $10 level.
Another Failure?
If there is no push above $6.60, the price might start a fresh decline. Initial support is near the $6.20 level. There is also a major bullish trend line forming with support near $6.20 on the daily chart. A close below $6.20 may perhaps start a drop toward the $5.80 level. Any more losses could set the pace for a test of the $5.50 support zone in the coming days.
Overall, DOT price is showing a lot of positive signs above the $6.20 support and the 50-day simple moving average (blue). A close above the $6.60 resistance zone could spark a decent rally in the coming sessions. Conversely, the bulls might struggle again and the price could drop below the $6.20 and $6.00 support levels.

News on crypto regulations
… [Trackback]
[…] Find More on on that Topic: coinchapter.com/dot-price-prediction-polkadot-could-surge-over-25-heres-how/ […]
… [Trackback]
[…] Info on that Topic: coinchapter.com/dot-price-prediction-polkadot-could-surge-over-25-heres-how/ […]
… [Trackback]
[…] Find More Info here to that Topic: coinchapter.com/dot-price-prediction-polkadot-could-surge-over-25-heres-how/ […]
… [Trackback]
[…] Find More to that Topic: coinchapter.com/dot-price-prediction-polkadot-could-surge-over-25-heres-how/ […]
… [Trackback]
[…] Read More to that Topic: coinchapter.com/dot-price-prediction-polkadot-could-surge-over-25-heres-how/ […]