

New Delhi(Coinchapter.com): Ethereum’s ETH price is rising above the 0.0740BTC zone. There could be a strong surge if the bulls push it above the 0.0755BTC resistance.
Ethereum (ETH) Price Bullish Vs Bitcoin
In the last ethereum vs bitcoin analysis, we discussed a possible bullish breakout. ETH/BTC remained supported above the 0.0680 zone and slowly moved higher.
However, the key upside break is still in progress. After trading as low as 0.0658, the price started a fresh increase. There was a clear move above 0.070 and 0.072 resistance levels. The bulls even pumped the price above the 61.8% Fib retracement level of the key decline from the 0.0792 swing high to 0.0658 low.
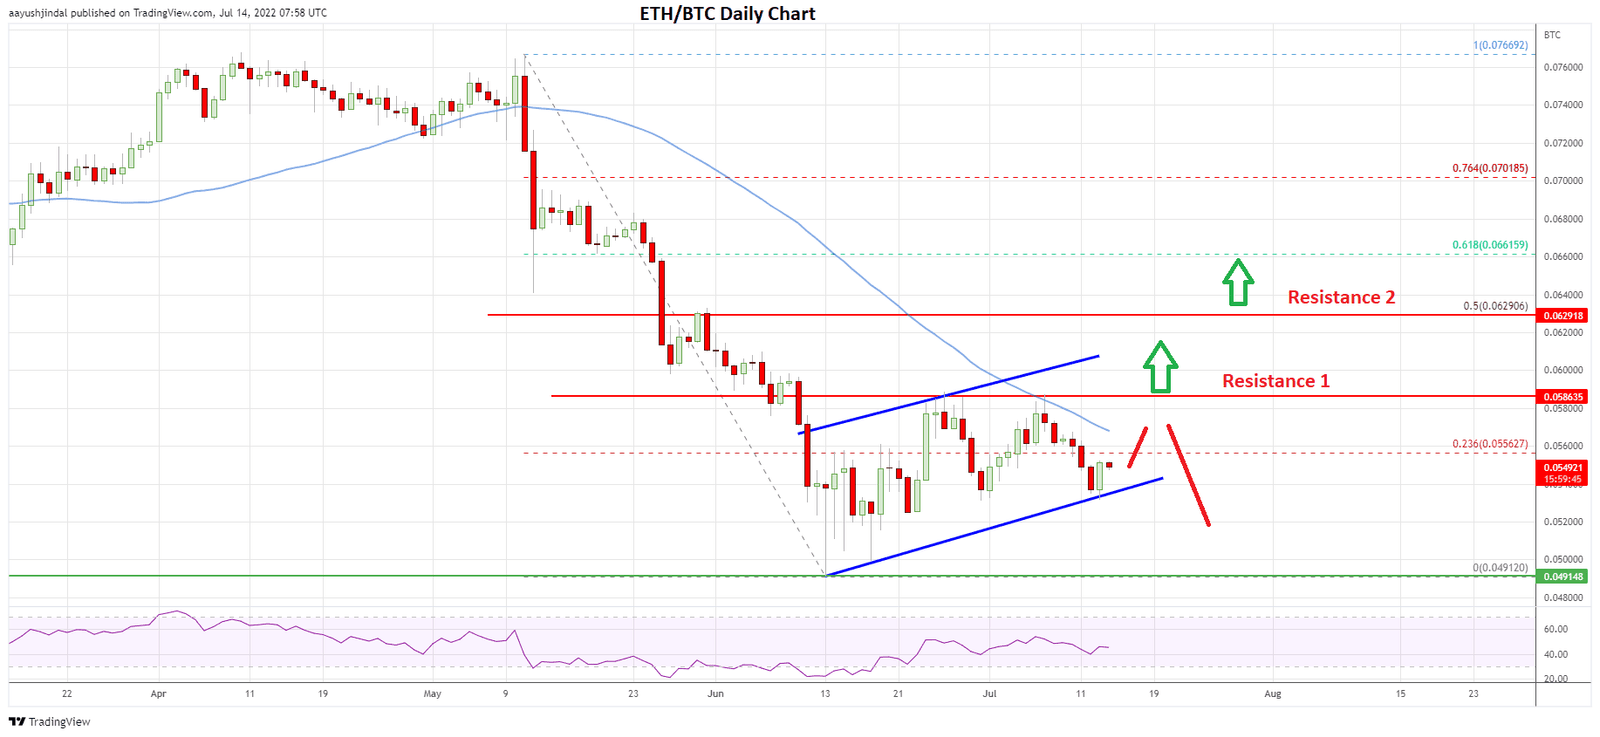
Etheruem’s price daily chart | Source: ETH/BTC on TradingView.comThe price is now trading comfortably above the 0.0732 resistance zone and the 50-day simple moving average (blue). On the upside, ether seems to be facing resistance near the 0.0755 level.
There is also a major bearish trend line with resistance near 0.0755BTC on the daily chart. The trend line is close to the 76.4% Fib retracement level of the key decline from the 0.0792 swing high to 0.0658 low. A clear upside break above the trend line resistance and 0.0760 may perhaps start a steady increase.
In the stated case, the price may perhaps rise towards the 0.0792 high. Any more gains might open the doors for a move towards the 0.0850 zone or even 0.0880.
Ethereum Dips Limited?
If there is no upside break above 0.0755BTC, ether price might correct lower. On the downside, there is a strong support forming near 0.0725 and the 50-day simple moving average (blue).
The main support seems to be forming near the 0.0700 level and a connecting bullish trend line. If there is a downside break below the 0.0700 support, the price might start a bearish wave. The next major support could be near the 0.0655 level, below which the price may perhaps decline towards the 0.0600 support area.
Overall, ether price is showing positive signs above the 0.072 support zone versus bitcoin. If there is a clear upside break above the 0.0755 resistance, ETH could start a fresh surge. Conversely, there might be a fresh decline towards the 0.0700 support zone or even 0.0655.

… [Trackback]
[…] Information to that Topic: coinchapter.com/eth-btc-ethereum-price-aims-fresh-surge/ […]
… [Trackback]
[…] There you can find 67063 additional Information to that Topic: coinchapter.com/eth-btc-ethereum-price-aims-fresh-surge/ […]
… [Trackback]
[…] Read More Information here on that Topic: coinchapter.com/eth-btc-ethereum-price-aims-fresh-surge/ […]
… [Trackback]
[…] Find More on on that Topic: coinchapter.com/eth-btc-ethereum-price-aims-fresh-surge/ […]
… [Trackback]
[…] Read More on that Topic: coinchapter.com/eth-btc-ethereum-price-aims-fresh-surge/ […]
… [Trackback]
[…] There you can find 96070 more Info on that Topic: coinchapter.com/eth-btc-ethereum-price-aims-fresh-surge/ […]
… [Trackback]
[…] Read More on to that Topic: coinchapter.com/eth-btc-ethereum-price-aims-fresh-surge/ […]