Key Takeaways:
- An analyst spotted a possible bull pennant on the Ethereum 3m chart.
- A discussion followed, with opposite approaches to the formation’s merit.
- Ethereum 4-hour chart flashed a symmetrical triangle.
YEREVAN (CoinChapter.com) – An anonymous crypto analyst with the Twitter handle, ShardiB, posted an Ethereum (ETH) chart that flashed a bullish formation dubbed bull pennant. However, the 3-minute chart focuses on a very limited time frame. Thus even if the pennant played out, the effects might not be instrumental on a larger scale.
Bull Pennant or no pennant?
The posted chart sparked quite a heated discussion, and the reactions ranged from enthusiastic support to ridicule. The pennant itself was arguably weak, as the formation did not quite adhere to the typical definition.
The latter includes two converging trendlines that tie the lower highs (resistance trendline) and the higher lows (support trendline). Unlike the similar symmetrical triangle, the pennant follows a flag pole, i.e., a sharp uptrend. On the chart above, the flagpole is present, but the consolidating price action that followed lacked the necessary price swing.
If the formation had played out, Ethereum could have broken out above $3,020. When the chart referred to (Seo. 30, 8 p.m. GMT), Ethereum was in an uptrend, but on a larger scale, the prediction didn’t pan out, as the bullish incentive subsided hours after.
Moreover, the pennants are typically more instrumental on a larger scale than the minute charts. The formation’s reliability declines in coherence with the zoomed time frame.
Also read: Ethereum targets $6.5K as exchange outflows reach record levels
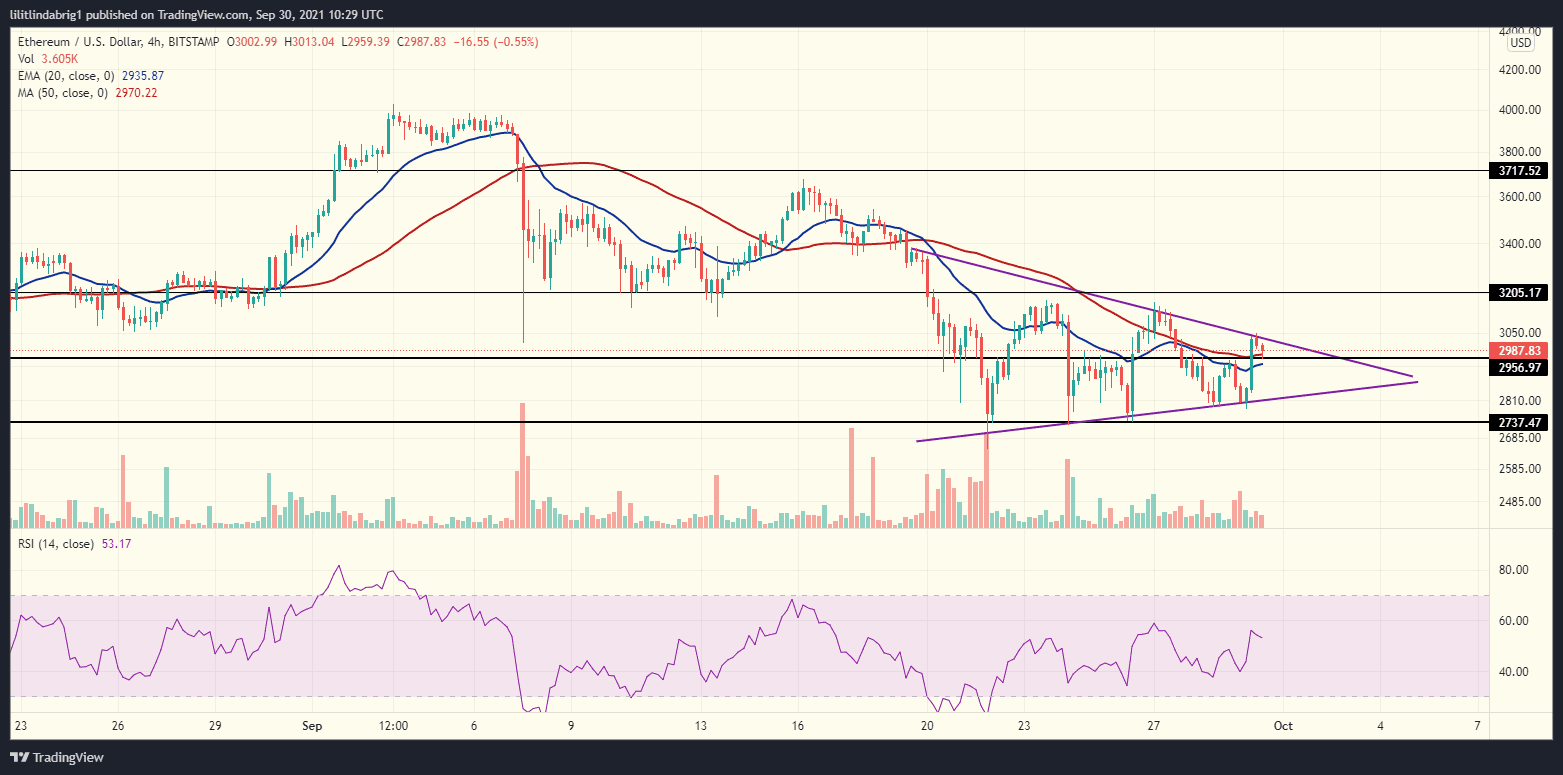
The ETH/USD rate hovered around $3,000 in the European session Thursday and continued to trade within the symmetrical triangle that was relevant for the past ten days.
Ethereum 4-hour chart
As mentioned above, the symmetrical triangle is similar to the bull pennant formation but lacks a distinctive flap pole. Furthermore, the triangle on the ETH 4h chart followed a 12-day consolidation period and a decline. Thus a bearish continuation is possible after the triangle is exhausted.
ETH already retested the upper trendline again in the Thursday session and came close to a significant support line at $2,956. Should the digital asset retest the noted support, it might manage a bullish break despite the formation’s prediction.
Ethereum, like many other altcoins, remains dependent on Bitcoin price action. For example, on Sep 7-8, Bitcoin lost over 13%. The second-largest cryptocurrency followed suit and shed 15% off its value. When the alpha crypto gained 10% on Sep. 22-23, ETH followed with a 15% uptrend.
The upcoming sessions will show if Bitcoin can confidently recover above $42,000 and bring the rest of the market along for the ride.
Also read: Ethereum bubble warnings return as ETH struggles below $3K.

… [Trackback]
[…] Read More Info here on that Topic: coinchapter.com/ethereum-bull-pennant-predicts-massive-rally-ahead-as-eth-reclaims-3k/ […]
… [Trackback]
[…] Read More Information here on that Topic: coinchapter.com/ethereum-bull-pennant-predicts-massive-rally-ahead-as-eth-reclaims-3k/ […]
… [Trackback]
[…] Read More to that Topic: coinchapter.com/ethereum-bull-pennant-predicts-massive-rally-ahead-as-eth-reclaims-3k/ […]
… [Trackback]
[…] Info to that Topic: coinchapter.com/ethereum-bull-pennant-predicts-massive-rally-ahead-as-eth-reclaims-3k/ […]