
NEW DELHI (CoinChapter.com) — Ethereum (ETH) prices suffered another round of selling on May 26, forcing prices to fall under $1,800. The sell-off continued on Friday, with ETH prices falling 5.2% between intraday high ($1,806) and low ($1,712) levels.
Moreover, ETH faces bearish headwinds after breaking below a technical pattern called the bearish pennant on May 25. The pattern forecasted a nearly 38% fall from the breakout level.
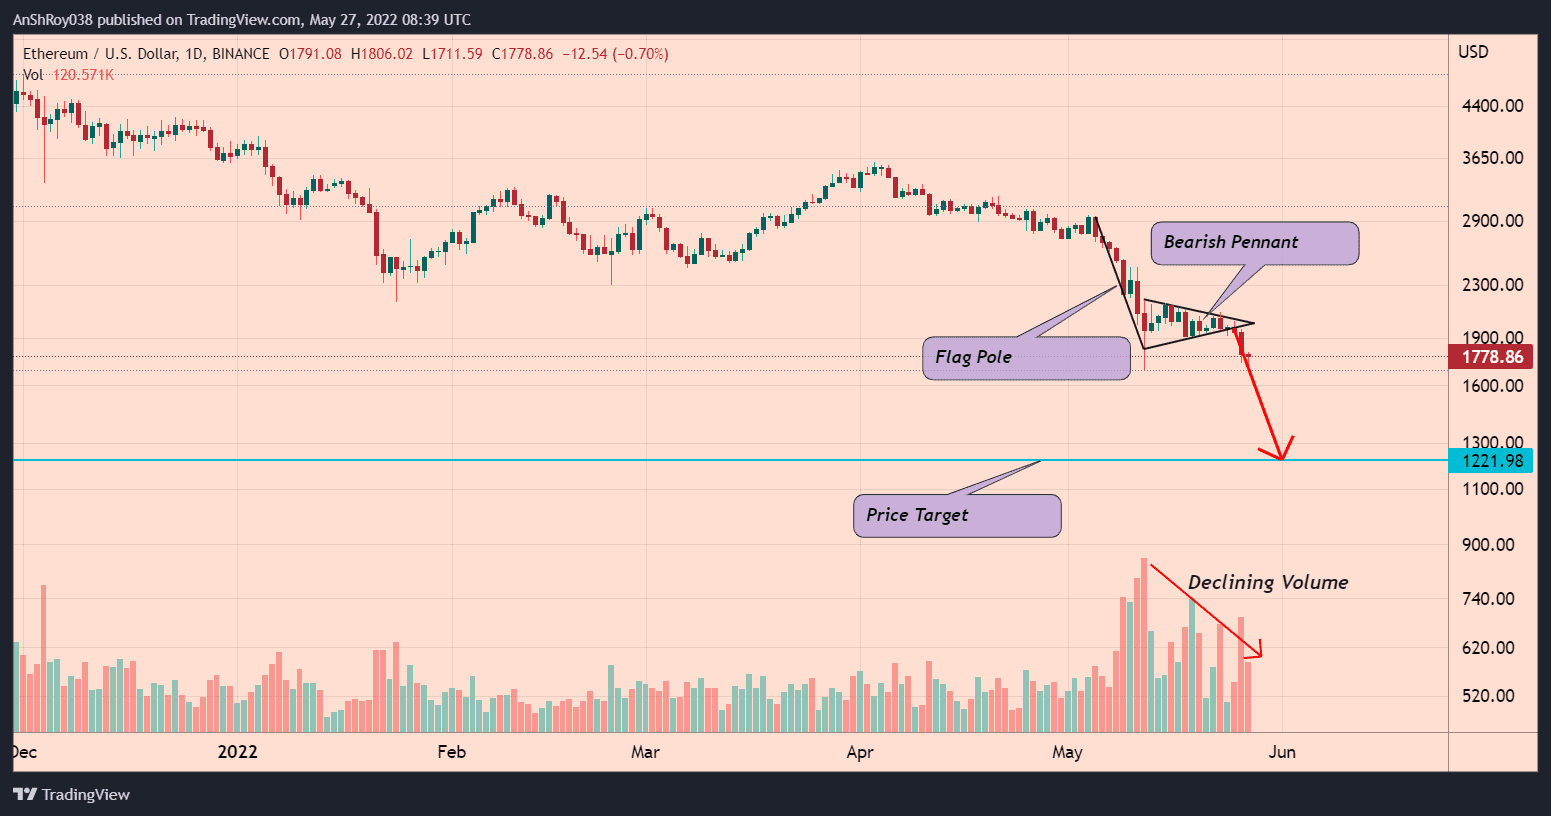
Pennants are continuation patterns. The pattern forms when a period of consolidation with converging trendlines follows a large movement in an asset’s prices. Then, the asset breaks out in the same direction as the large initial movement.
Volumes play an important role in verifying the pattern. As per technical analysis rules, the consolidation should occur with lower volumes, while higher volumes should accompany breakouts.
Traders calculate the price target by applying the initial flagpole’s height to the point where the price breaks out from the pennant. As a result, ETH prices might continue trending downwards to reach $1,220, paring nearly 31.3% from current prices.
Number Of Ethereum Addresses In Profit Decline
Meanwhile, on-chain data analytics firm Glassnode noted that the number of Ethereum addresses in profit hit a 22-month low on May 27. The on-chain metric measures the balances of assets transferred into a wallet at an average price lower than the current price.
Also Read: 3 reasons why you don’t own enough Ethereum (ETH).In other words, their value has gone up, creating a profit, at least on paper.
Ethereum’s recent downtrend has put nearly 42% of Ethereum addresses in losses. On the other hand, the Ether (ETH) supply last active (5 year – 7 year) reached an ATH of 9,615,871.812 ETH. Glassnode shared the information in a tweet on Friday.
An increase in inactive supply indicates a hodling mentality in investors. Conversely, ETH’s decreasing active supply might help Ether prices stage a comeback.
Ethereum’s fee levels remain extremely low, indicating low user activity. Furthermore, the low activity indicates a negative mentality among investors.
On-chain intelligence firm Santiment noted that the decline in user activity coincides with decreased stablecoin velocity. In detail, velocity measures how quickly money circulates in the crypto economy.
Oversold RSI
Ether’s relative strength index remains right at the edge of the oversold region. ETH’s RSI is currently neutral, with 31.01 on the daily charts.
RSI measures the magnitude of recent price changes to analyze overbought or oversold conditions. An oversold RSI indicates a bullish trend reversal is on the cards. With ETH prices at oversold levels, investors who rely on RSI would likely move in to buy the dip and trigger a rally.
Also Read: No major bullish impact on ETH as Ethereum prepares for ‘Merge’ upgrade in August.Furthermore, the long lower wicks suggest bulls are actively buying the dips.
IF ETH reverses its downtrend, the prime altcoin’s prices would need to move above immediate resistance near $1,900. In addition, a move above immediate resistance would help ETH prices challenge resistance from the 20-day exponential moving average (red wave, 20-day EMA) near $2,080.
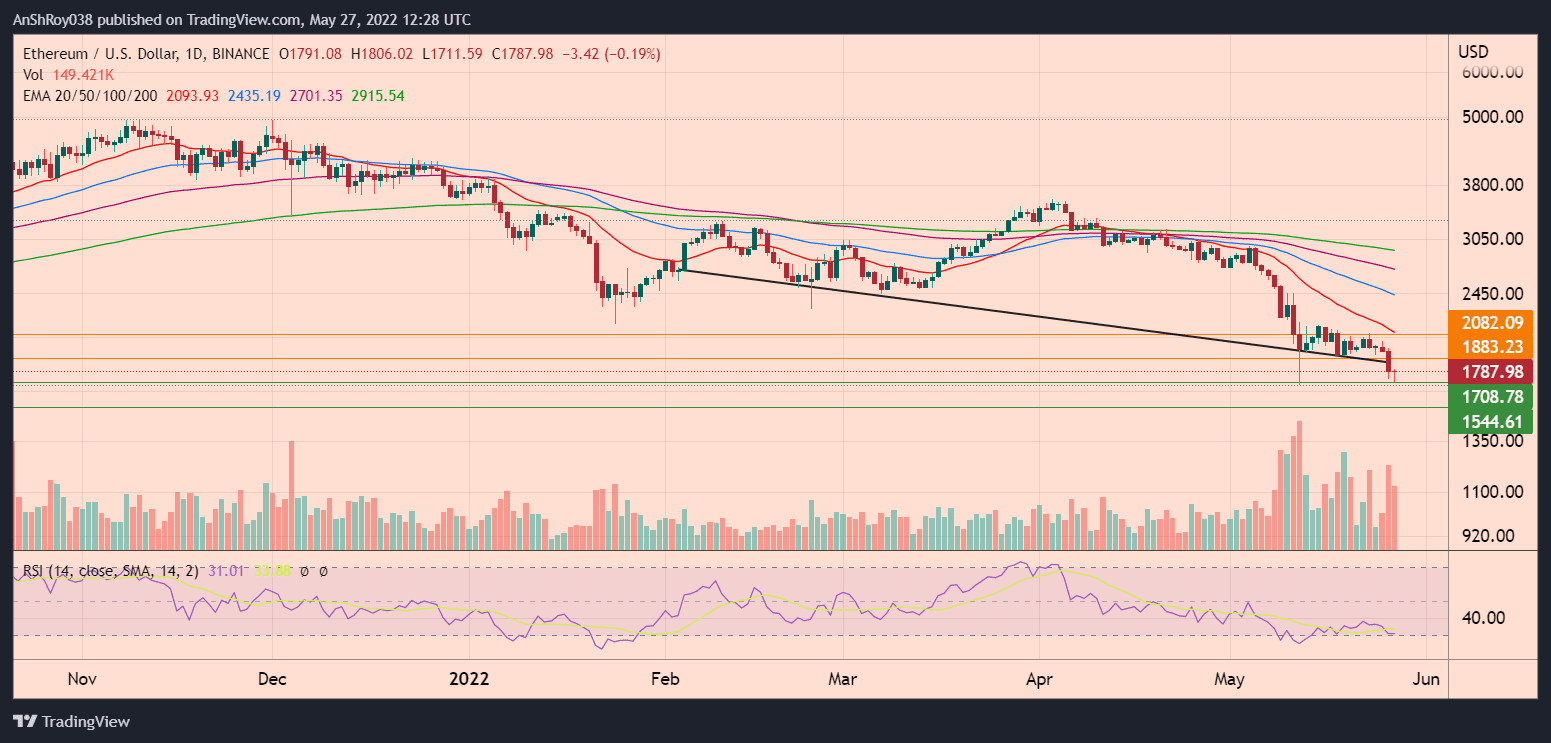
Meanwhile, May 26’s 7.7% fall pushed ETH prices below a multi-month support trendline. If Ether fails to reverse its downtrend, the token’s prices might test support near $1,700. However, ETH prices recently rebounded off the $1,700 support.
Finally, a sustained downtrend might push ETH to support near $1,550 before the token recovers.
At the time of writing, ETH was trading at $1,809, up 1% on the day.

… [Trackback]
[…] Find More on that Topic: coinchapter.com/ethereum-likely-to-reach-1-2k-from-1-8k-after-bear-pennant-breakout/ […]
… [Trackback]
[…] There you can find 55654 more Information to that Topic: coinchapter.com/ethereum-likely-to-reach-1-2k-from-1-8k-after-bear-pennant-breakout/ […]
… [Trackback]
[…] Find More on that Topic: coinchapter.com/ethereum-likely-to-reach-1-2k-from-1-8k-after-bear-pennant-breakout/ […]
… [Trackback]
[…] Read More Information here to that Topic: coinchapter.com/ethereum-likely-to-reach-1-2k-from-1-8k-after-bear-pennant-breakout/ […]
… [Trackback]
[…] Info on that Topic: coinchapter.com/ethereum-likely-to-reach-1-2k-from-1-8k-after-bear-pennant-breakout/ […]