

NEW DELHI (CoinChapter.com) — Ethereum’s upcoming migration to the Proof-of-Stake (PoS) consensus mechanism, dubbed ‘the Merge,’ seems to be back on track. Earlier this year, the network had pushed back the update.
Developer activity on GitHub indicates that Ethereum’s public testnet, Ropsten, will undergo the ‘merge‘ in June. The switching of consensus mechanism requires networks to deploy the changes on multiple testnets to ensure the update’s stability before upgrading the mainnet.
Recent reports speculate the testnet merge will happen on June 8.
Moreover, Preston Von Loon, an Ethereum (ETH) network core developer, said the Ethereum Mainnet Merge would likely occur in August. Von Loon was speaking at the Permissionless Conference in Palm Beach, Florida.
As far as we know, if everything goes to plan, August — it just makes sense. The difficulty bomb is there, it’s there for a reason. If we don’t have to move [the difficulty bomb], let’s do it as soon as we can.
Preson Von Loon said at the Permissionless ConferenceAlso Read: Ethereum merge delay could upset its chances of displacing Bitcoin.The Ethereum developer also told attendees that they are “at the last few steps” and that the momentum is in their favor.
Justin Drake, a researcher from the Ethereum Foundation, noted that ensuring smooth merge execution is a top priority. Additionally, Drake also shared a strong desire to make the merge “happen before the difficulty bomb in August.”
In detail, the difficulty bomb is a piece of code that would help degrade the network by slowing it down. The idea was to encourage developers to switch to the PoS and, at the same time, make it hard for miners to stick with the Proof-of-Work chain after the switch.
Ether Supply Last Active Reaches 3-Month Low
Meanwhile, on-chain market intelligence Glassnode data shows the amount of Ether (ETH) supply last active (3 months – 6 months) reached a 3-month low of 9,407,792.637 ETH. The firm shared the information in a May 20 tweet.
An increase in inactive supply indicates a hodling mentality in investors. However, Ethereum’s inactive supply decreases, indicating that Ether holders are trading their ETH instead of holding them.
Also Read: Ethereum losing institutional investment while ETH eyes 56% losses.In addition, the decline in inactive supply also adds bearish cues to ETH’s price action. The change in mentality is likely a result of the crypto market rout last week, which saw Ethereum prices fall below $2,000.
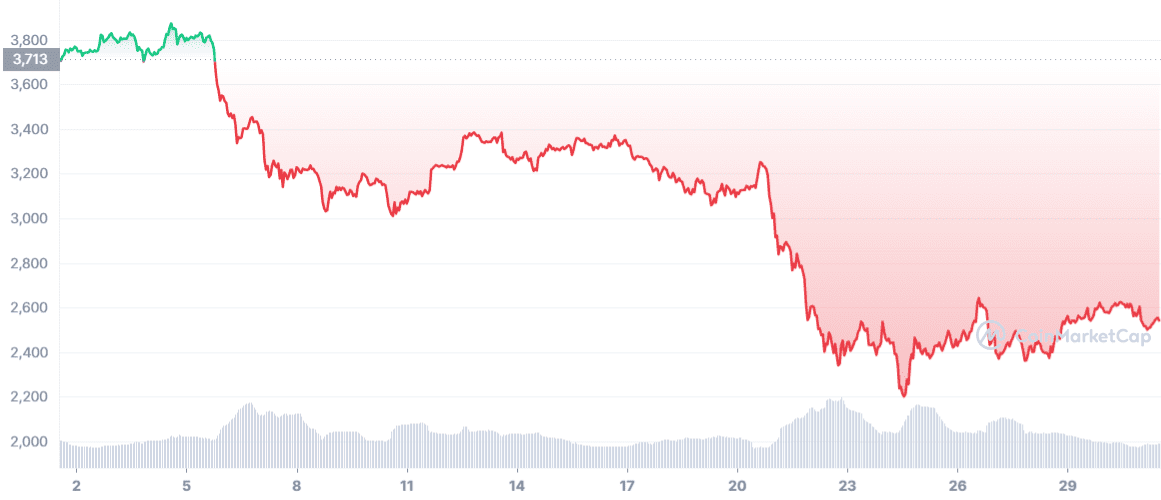
Furthermore, Ethereum prices have been downtrend for the last thirty days. Last week’s market rout resulted in ETH prices dropping to levels last visited in Jul 2021.
Ether prices have been range-bound between $1,970 and $2,150 since May 12.
ETH Prices Charts A Death Cross
Ethereum prices jumped more than 8% between May 19’s low of $1,900 and Friday’s intraday high of $2,060. Unfortunately, ETH has been unable to consolidate above $2,000 after falling below the level due to last week’s crash.
ETH price action has resulted in the prime altcoin’s 50-day moving average (50-day MA, yellow wave) cross below its 100-day MA (purple wave) to chart the death cross’s bearish pattern. Traders often consider the pattern an indicator of bearish market sentiment.
The bearish cues might force Ether prices to fall to immediate support near $1,900, which recently helped arrest the ETH downtrend during the crypto hell-week. However, a death cross-induced FUD might push Ethereum prices to support near $1,780.
Finally, a marketwide sell-off could result in ETH price testing support near $1,660 before recovering. Meanwhile, the Ether token remains inside the trendlines of the Bollinger Bands indicator.
In detail, Bollinger bands consist of a simple moving average (middle band) and an upper and lower band. The two bands are usually two standard deviations from the middle band. A move above or below the bands indicates overbought or oversold conditions.
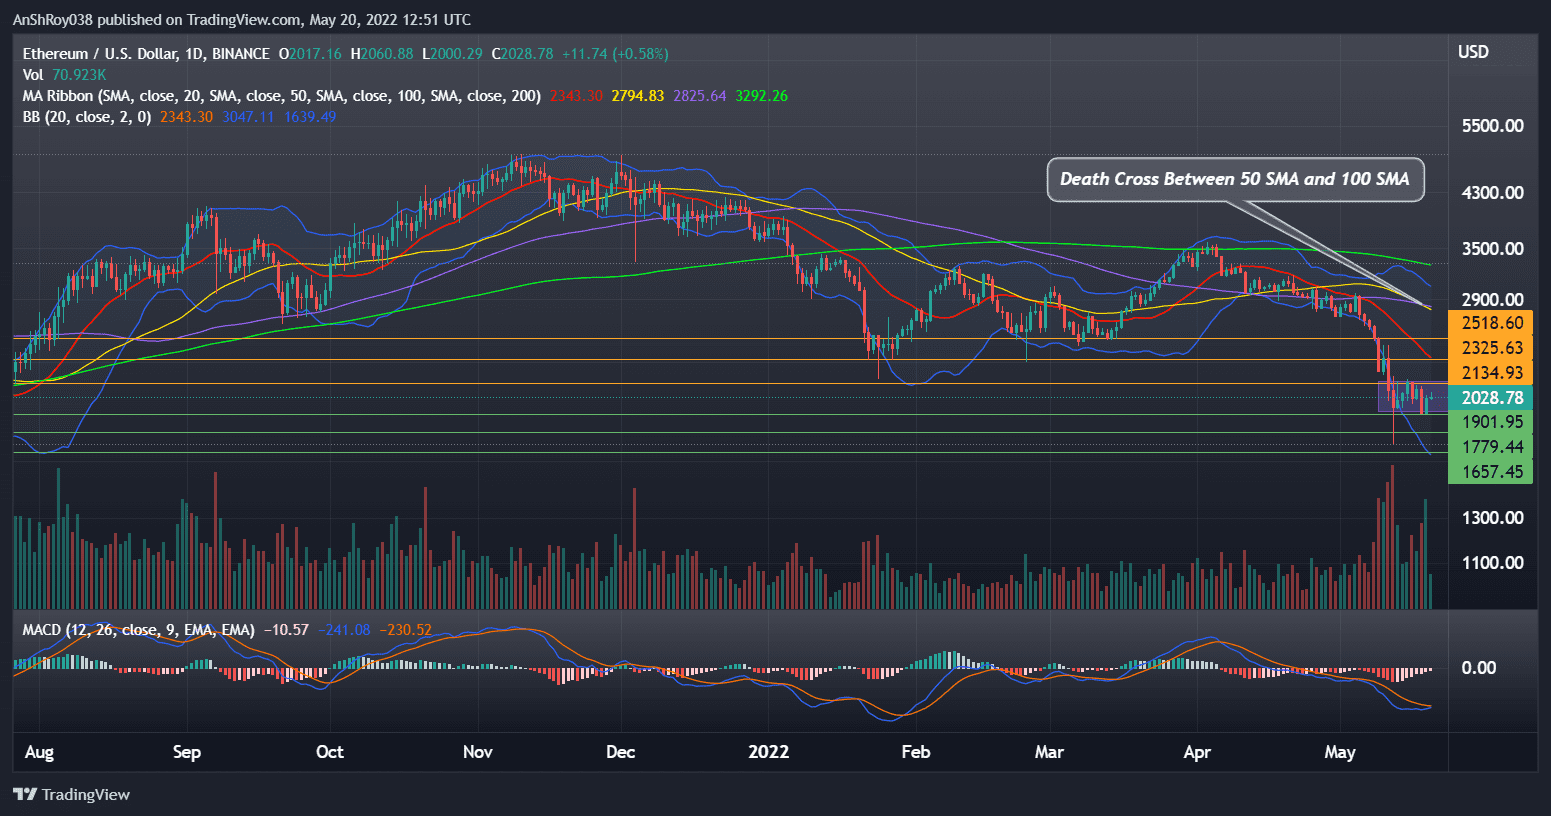
In addition, MACD, a trend-based momentum oscillator, forecasts a strengthening upward momentum for the Ether token.
Also Read: Ethereum’s place in the finance digitization space may help appreciate Ether prices.Negative bars on the MACD histogram have been contracting, indicating that the MACD line (difference between 12-day and 26-day EMA) is moving towards the MACD signal line (9-day EMA of MACD) and may soon chart a bullish crossover.
Traders usually consider the technical pattern a buy signal.
To start an uptrend, ETH prices would need to move above immediate resistance near $2,130. A move above immediate resistance might help ETH prices challenge resistance from its 20-day MA (red wave) near $2,325.
Finally, a sustained uptrend could help Ethereum prices rise to $2,500 before retreating.
At the time of writing, ETH was trading at $2,043, up 1.29% on the day.

… [Trackback]
[…] Read More here to that Topic: coinchapter.com/no-major-bullish-impact-on-eth-as-ethereum-prepares-for-merge-upgrade-in-august/ […]
… [Trackback]
[…] Find More Information here to that Topic: coinchapter.com/no-major-bullish-impact-on-eth-as-ethereum-prepares-for-merge-upgrade-in-august/ […]
… [Trackback]
[…] There you can find 67363 additional Info on that Topic: coinchapter.com/no-major-bullish-impact-on-eth-as-ethereum-prepares-for-merge-upgrade-in-august/ […]
… [Trackback]
[…] Read More Information here on that Topic: coinchapter.com/no-major-bullish-impact-on-eth-as-ethereum-prepares-for-merge-upgrade-in-august/ […]