Key Takeaways:
- Ethereum whales make a move on Shiba Inu and buy out $88 million worth of SHIB.
- SHIB did not respond and still consolidated around $0.000020.
YEREVAN (CoinChapter.com) – Canine-inspired meme token Shiba Inu (SHIB) enjoyed increased attention from Ethereum (ETH) whales. According to the whale-tracking website WhaleStats, the richest ETH investors doubled down on $88 million worth of SHIB in 24 hours.
In doing so, the 262nd-largest ETH wallet scooped over $34 million worth of SHIB, while the 29th-largest bought nearly $40 million worth of the token. The massive accumulation appeared in addition to the top 1,000 Ethereum wallets that already hold more than $1.155 billion in SHIB tokens.
In fact, SHIB holdings represent 13.78% of their non-Ethereum holdings, second only to FTT, the native token of FTX crypto exchange, which represents 15.56%, says WhaleStats.
Also read: McDonald's trolls Elon Musk over Dogecoin: Creates a new cryptocurrency 'Grimace Coin.'Moreover, in the pursuit of abandoning the meme-coin stigma behind, Shiba Inu announced it was “welcoming the Shibaverse,” an immersive experience for the ecosystem and the Metaverse space.
Also read: Shiba Inu whale buys 58.90B SHIB tokens for $1.9M․ However, despite the positive developments, SHIB’s price did not react. The SHIB/USD exchange rate consolidated at $0.000020 on Thursday, as shown in the CoinMarketCap chart below.

SHIB’s conflicting technicals
Shiba Inu’s daily chart painted a bullish picture despite an over 75% decline from the all-time high of 0.000088 on Oct 28. The digital asset formed a Falling Wedge, which features two trendlines with a negative slope and a significant mid-range.
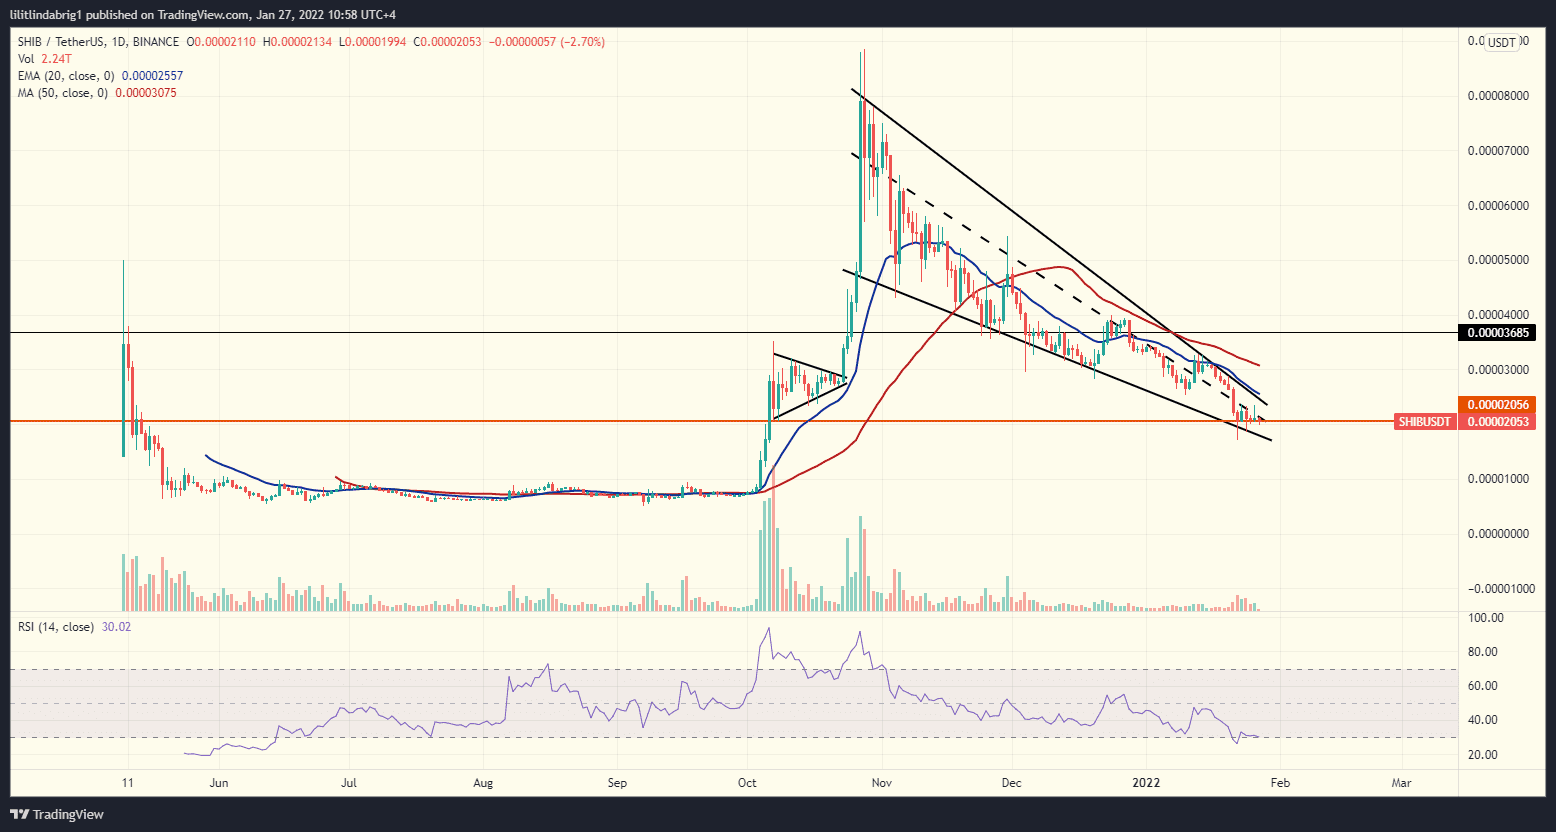
Additionally, the reversal pattern could see SHIB break the resistance trendline in the upcoming sessions. As of publication, SHIB enjoyed a confluence of support, including the 0.000020 level (orange on the chart above), that was instrumental before the October surge.
Also read: Cryptocurrency Prices Today: DOT, SHIB, AVAX, LTC.However, a closer look at the four-hour chart hinted at a possible decline in the short term. SHIB printed another formation, dubbed “Symmetrical Triangle.” The latter is a continuation pattern that typically repeats the bias preceding the Triangle.
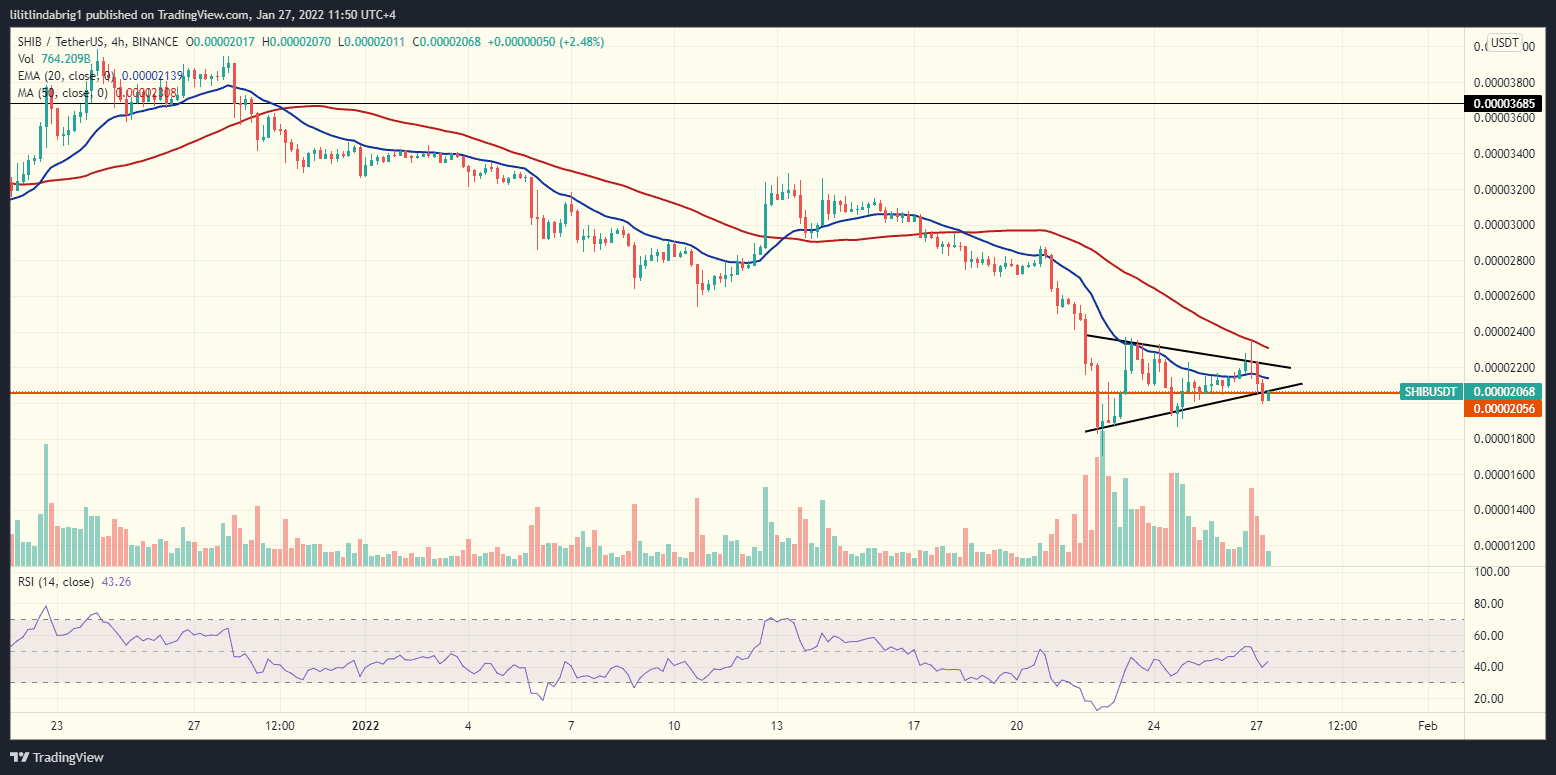
A similar bias could follow as the Triangle formed after a bearish phase. Thus, another 10% drop back to the Falling Wedge support is in the cards, which would bring SHIB to $0.000018. The upcoming sessions will show if the prediction pans out.

… [Trackback]
[…] Info to that Topic: coinchapter.com/ethereum-whales-gobble-up-shiba-inu-shib-with-no-effect-on-the-price/ […]
… [Trackback]
[…] Info to that Topic: coinchapter.com/ethereum-whales-gobble-up-shiba-inu-shib-with-no-effect-on-the-price/ […]
… [Trackback]
[…] Information on that Topic: coinchapter.com/ethereum-whales-gobble-up-shiba-inu-shib-with-no-effect-on-the-price/ […]