
Key Ethereum Takeaways:
- The largest DeFi platform Ethereum saw seven consecutive days of deflationary issuance.
- Its native token Ether (ETH) consolidated above a significant resistance-turned-support bar.
YEREVAN (CoinChapter.com) – Ethereum’s native token Ether (ETH) climbed above the $4,300 line in the Asian-Pacific session Tuesday as its network burnt more tokens than it produced seven days in a row, creating a supply crunch against rising demand.
Ether token burn and deflationary issuance
In detail, Ethereum has been notorious for its high transaction fees and congested network issues. As a solution to the problem, it implemented an improvement proposal dubbed EIP-1559 as a part of the ‘London hard fork’ upgrade in early August.
The upgraded protocol started burning a portion of fee miners collect for adding and validating transactions on the Ethereum market. As a result, the Ether tokens’ circulating supply rate decreased, making it disinflationary in nature.
Meanwhile, with gas prices sustaining at a high level, Ethereum’s token issuance has been deflationary for seven consecutive days. For Ethereum to consistently produce deflationary blocks, gas prices must remain roughly above 150 gwei (10-9 ETH).
Also read: Ether holds above $4,000 as Ethereum's Altair upgrade approaches.Ethereum co-founder Anthony Sassano commented that he did not expect ETH to become deflationary before “the merge,” i.e., the network’s complete transition to ETH 2.0. The network scheduled the said shift from proof-of-work to proof-of-stake consensus mechanism for Q1-Q2 2022.
He also added that EIP-1559 did not increase the gas fees but stabilized the network.
Contrary to popular belief, EIP-1559 has not increased gas prices and has in fact helped considerably with spikes in demand (such as during hyped-up NFT mints) which has led to a smoother network overall.
added the executive. Additionally, according to the analytical platform Glassnode, Ethereum’s mean gas price has shot up to 171 gwei.
Also read: Ethereum ETF launch, bullish technicals point to $15K ETH price in 2022Amid the deflationary issuance, Ether price action consolidated since Oct 29, albeit holding above the $4,300 line.
ETH daily chart
Ether has gained 46% quarter-to-date and traded at $4,348 in the Asian-Pacific session Tuesday, after establishing a new all-time high of $4,460 on Oct 29. The digital asset turned the $4,176 – 4,276 resistance bar into support and moved sideways.
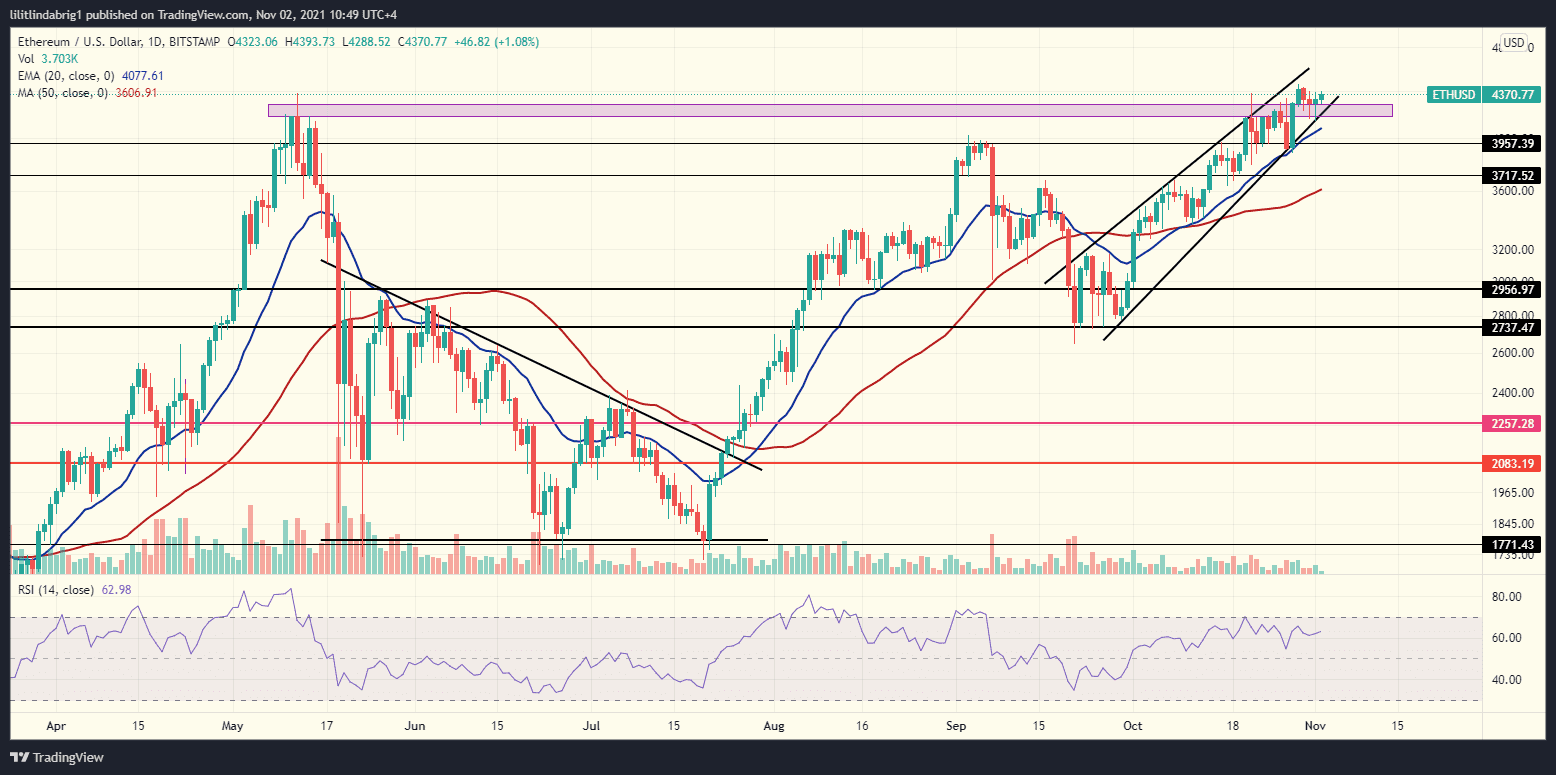
The alpha altcoin also flashed a bearish Rising Wedge. The formation consists of two converging trendlines that drive the price up but predict a downtrend once the token exhausts the pattern. However, the relative strength index (RSI; purple graph at the bottom of the chart) remains strong at 73.
In detail, the RSI reflects the traders’ level of confidence in an asset. Thus, when the indicator holds between 50 and 70, the investors are not likely to pull their bets, as they expect more gains.
Also read: Ethereum DeFi TVL clocks all-time high, but protocol tokens lose value.
Given Ether’s deflationary issuance and the subsequent supply squeeze, Ethereum’s price could increase in the upcoming sessions and establish a new all-time high, despite technical warnings.

… [Trackback]
[…] Find More Info here on that Topic: coinchapter.com/ethereums-first-week-of-deflationary-issuance-sees-eth-hold-above-4-3k/ […]