
Key Takeaways:
- Ethereum’s deflationary model could add bullish tailwinds for its token.
- ETH price has formed a bullish continuation pattern.
NEW DELHI (CoinChapter.com) — Ethereum might be heading for bullish waters soon, thanks to the prime altcoin’s burn mechanism turning ETH deflationary.
Per data from Ultrasound.money, the ETH supply rate has been negative since early 2023, underscoring the deflationary pressure on the token. A negative supply rate implies that Ethereum is burning more tokens than it creates in a particular time frame.
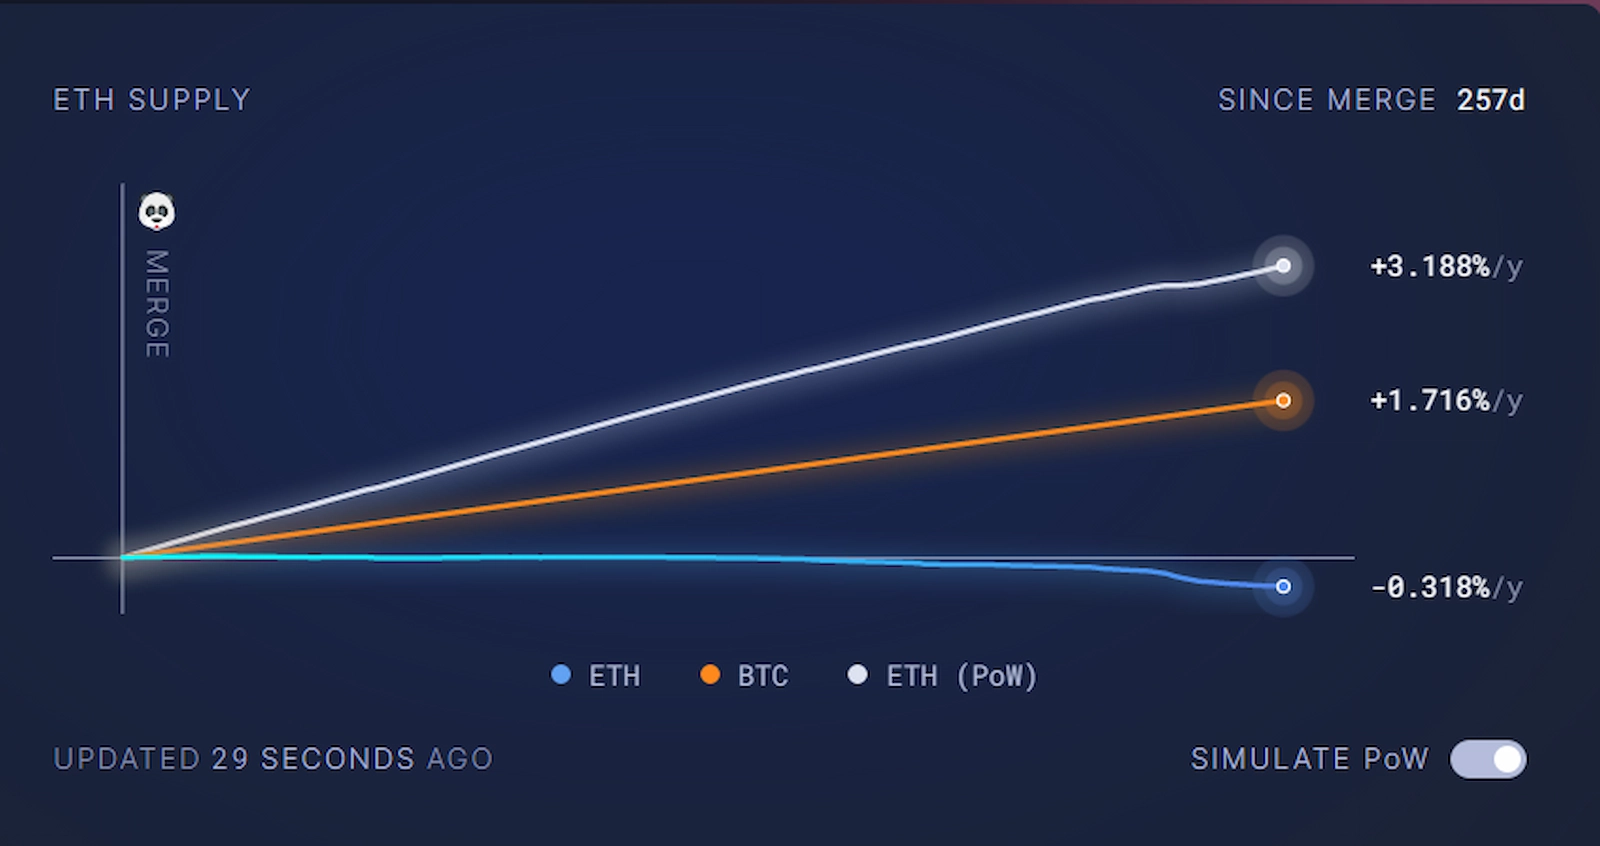
Since ETH had no limit on the number of tokens, concern over its supply had begun rising before the platform introduced the EIP-1559 upgrade. Ethereum introduced a fee-burning mechanism to make ETH deflationary.
After Ethereum’s transition to the proof-of-stake consensus mechanism, the ETH supply rate became deflationary for the first time in Oct 2022. A spike in ETH gas fees, likely due to the memecoin frenzy in April 2023, increased gas fees. As a result, the ETH burn rate climbed.
At the current staker issuance reward and burn rate, ETH total circulating supply would start declining around May 2024. Ultrasound.money predicted ETH would burn and issue around 726,000 ETH per year after the supply reaches an equilibrium level.
ETH Might Rally 80% If It Confirms Bullish Flag Pattern
ETH price has formed a bullish continuation pattern called the ‘Bull Flag.‘
Assets with strong uptrends usually form the pattern. Bull flags consist of a flag pole, resulting from a near-vertical rise in the crypto token’s prices.
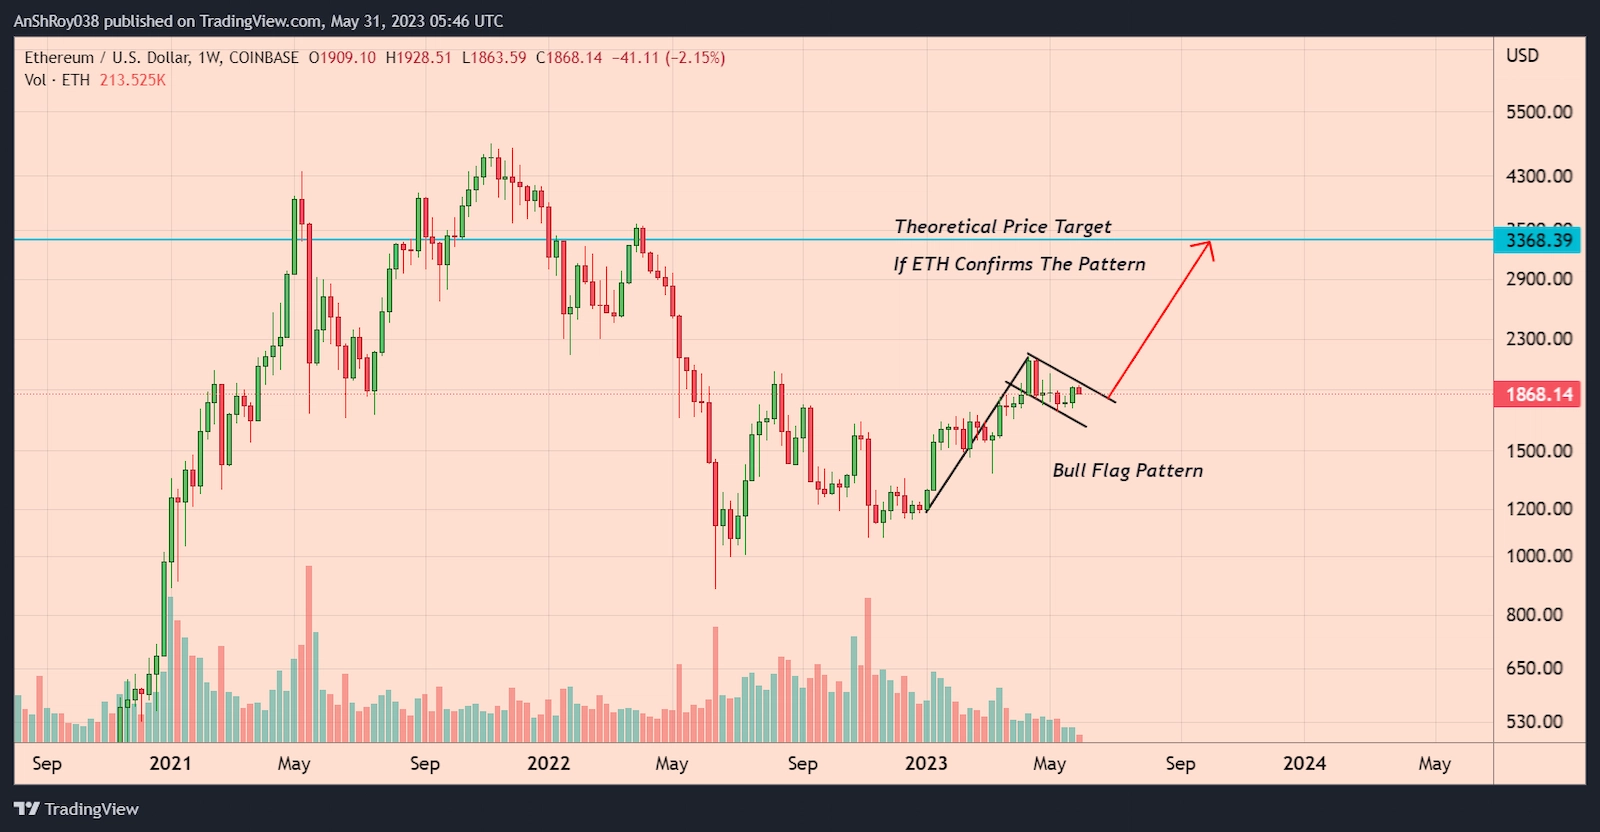
A period of consolidation succeeding the steep uptrend forms the flag of the pattern. Despite the strong vertical rally, the asset price does not drop as bulls maintain the buying pressure. As a result, the breakout from the flag pattern often results in a powerful uptrend.
Also Read: More Volatility for Bitcoin, Report Says – 3 Reasons WhyTraders calculate the price target of the breakout by adding the length of the flag pole to the breakout price level. Per the rules of technical analysis, ETH price might rally over 80% to reach near $3,370 once it confirms the pattern.
Independent market analyst Christopher Inks tweeted about ETH price forming the bull flag. Inks noted that the prime altcoin was testing the pattern’s resistance. The analyst further added,
[…]breaking out above the weekly pivot will add confidence to the bullish trend off the June 2022 swing low.
$1,900 Resistance Rebuffs Ether Price
Meanwhile, Ethereum bulls failed to move above the immediate resistance for the token near $1,900. Long upper wicks on recent daily candles highlight the bears’ presence near the resistance level, with ETH price dropping about 2% to form a daily low near $1,857.
Bulls would likely try to keep ETH price above the 20-day EMA (red wave) and 50-day EMA (purple wave) confluence support. However, breaking below the EMA trendlines might cause the Ether price to drop to its support level near $1,816.
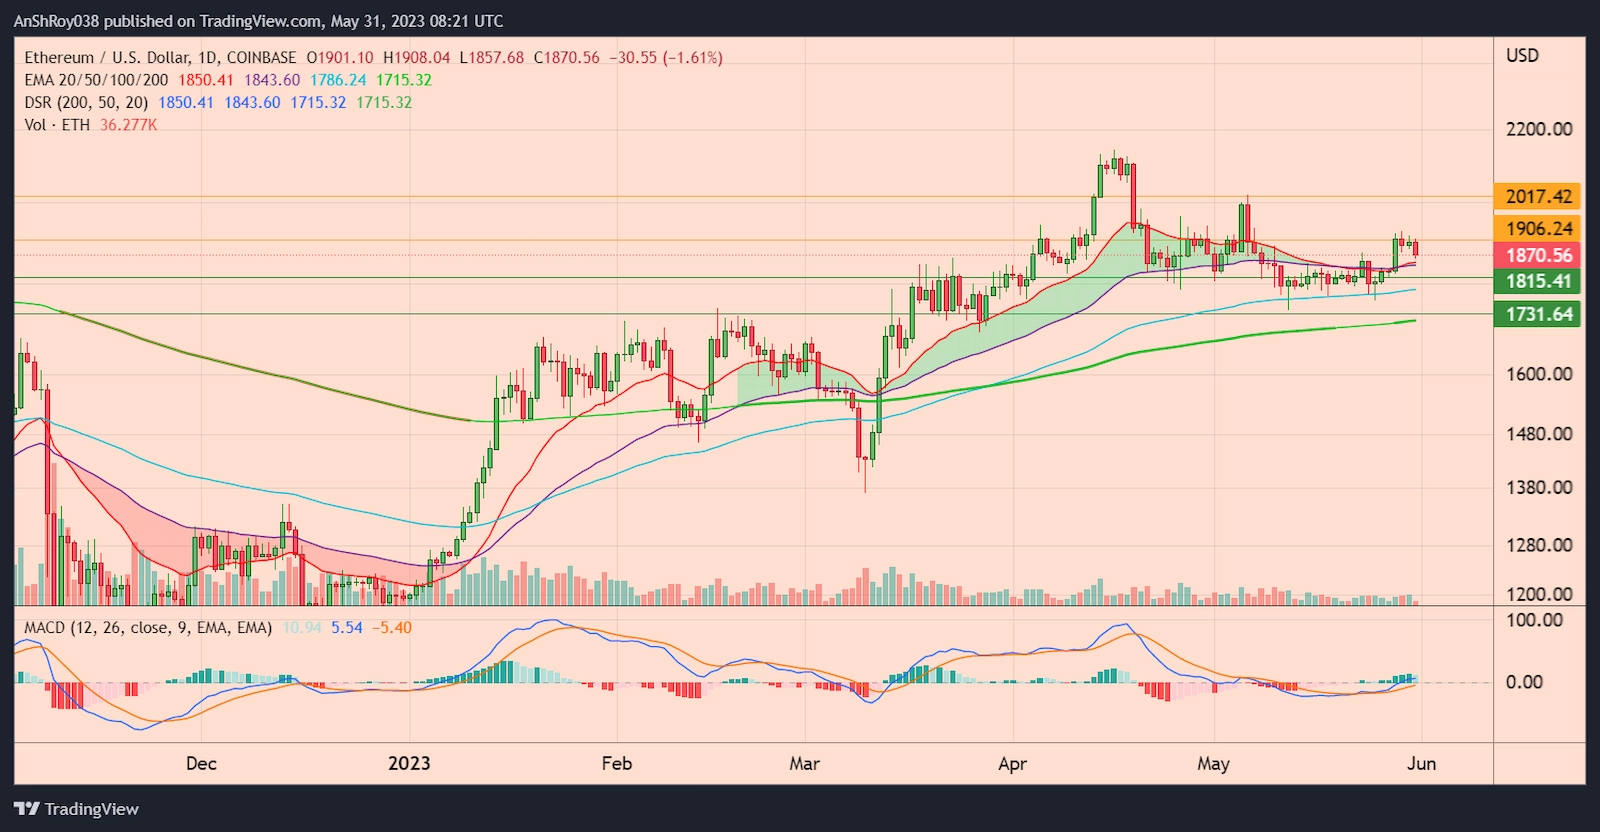
Moreover, breaching the immediate support level might result in ETH price testing the 200-day EMA (green wave) support level near $1,730.
The moment oscillator MACD is also giving bearish signals for ETH price. Positive (green) bars on the MACD histogram are contracting, signaling that the MACD line (difference of 12-day and 26-day EMA) is moving downward and could needle below its signal line (9-day EMA of MACD).
However, if buyers enter the market and bulls successfully defend the EMA support level, ETH price could rise above the $1,900 resistance. Braking above the immediate resistance would provide the Ethereum token the momentum needed to challenge resistance near $2,017 before correcting.

… [Trackback]
[…] Info to that Topic: coinchapter.com/ethereums-negative-supply-rate-could-help-eth-price-spike-80/ […]